

Portfolio Analysis: Igniting a long-term spirit in a short-term world (XX). Shell Directional Policy Matrix (DPM)
Have a divine relaxing weekend. Today´s purpose is to cover the Shell Directional Policy Matrix (DPM), which is also a traditional tool for portfolio analysis. It was originated to analyze qualitative factors present in the SBUs, which also need to be included in corporate planning (1). The origin of this toolkit was to offer a comparative overview between SBUs, to provide more intelligent tools than only financial forecasting or financial return predictions. The whole idea of the Shell DPM foundation was to overcome the bias or predisposition towards financial returns. We will explore this topic today, and by next Tuesday we will complete it.

All these portfolio tools were originated in the 1970s and were ready to be taught in business schools by the 1980s. It took 10 years to arrive in the MBA Strategy books!. Almost every single multinational (MNC) organization took the advantage of them. Consulting recognition houses were hired to tailor-made the tool for the specific aspects of each SBU industry in which the MNC was working. Therefore, if you see similarities between the GE Matrix and the BCG matrix, that is the way these matrixes came out.
Oldies frameworks are immeasurable helpful. The reason why we have decided to show you how to do portfolio analysis with these “old” matrixes sets is straightforward: Eleonora Escalante Strategy is convinced that the review and careful update of human development, sustainability, social and community factors should have to be included then (40 years ago). If the frameworks would have been corrected then, no issues with the global supply chains would have risen. And probably the design thinking research (DBR) of the global trade and commerce would have never been rolled out in China and other emerging markets as they had been established. Currently, to continue swaying the roadmap for the Fourth Industrial Revolution under the existing premises of international trade, under the mess of confusing corporate strategy and business strategy concepts, or under the bad structure of corporate strategic planning coming from business strategy toolkits… all the latter are a huge mistake, that the next generations will bear. That is why we are always repeating: changes to fix all our corporate strategy confusions and issues need to start with the frameworks that we learn in business schools!.
Strategic reflections at an exhibition. The reason why Eleonora Escalante Strategy is writing these sagas has a rationale beyond our purpose. It is linked to causing a strategic reflection of all these matters to decision-makers and managers working for MNC´s private and the United Nations network of organizations. Also, these sagas are for the benefit of any single business owner who started as an entrepreneur or is planning ahead to build his or her own business empire in the future. This saga is for all the entrepreneurs without money that are searching for investments, such as the applicants to Shark Tank and other private equity investors/venture capitalists or banks. Particularly it is dedicated to all those disruptive tech entrepreneurs with more than one SBU or a portfolio of businesses.
Portfolio Analysis is one of the crucial tasks at the corporate strategy level, and we need to change the way of doing it. It is a pre-requisite before contemplating to go ahead into a new behemoth of technologies that will cause our own self-destruction in the future. We are on duty to “open the eyes” of practitioners, academics, business owners, and SBU managers. We are not fatalist about our thoughts, we simply have collected 25 years of experience (multiple learning from mistakes) that have built a robust brainy reviewability and 360 degrees evaluation capacity that we must share and are obliged to display it, in our quest to practice corporate strategy as state of art creation.
Armando´s Rhumba. In our last post, we leave you with the marimba interpretation of Chick Corea and Gary Burton’s song “Armando´s Rhumba”. Chick Corea, one of the best jazzists of the century, recently passed away. He deserves to be in this saga. As an artist, he took decades of dedication to raise its model of producing unique jazz songs, with a mixture of tribal and Latin rhythms blended with “fantastic” compositions. Jazz is my interpretation of doing corporate strategy in music terms. Sometimes a mess of instruments and disparity creates an emerging lovely song as “Armando´s Rhumba”, and that is the way “corporate strategy” ought to sound when integral wellbeing factors for humanity, peace, environment recovery, and middle-class strengthening are encompassed. Stunning as the marimba and piano notes of that song!
Origin of the Shell Directional Policy Matrix. After the awakening of matrix tools for portfolio analysis, most multinationals, or when international corporations with multiple SBUs took the BCG or GE Matrix, then many corporations decided to refine it and adapt it for their specific needs. The concept of directional policy matrix got off and, that is how we see the Shell DPM in many strategy textbooks. In the 1970s, The Royal Dutch Shell Group (as a parent company) approved that one of its companies, the Shell International Chemical Company Ltd., designed a tool that could include qualitative and quantitative considerations in addition to the financial yardsticks. The Shell group wanted to systematize a new tool, called “Shell Directional Policy Matrix (DPM)”. This specific concept DPM was conceptualized as a technique to build future corporate plans.
The Shell DPM main objective was to identify (2):
1. The main criteria by which the prospects for a business sector or business units may be judged to be favorable (*) or unfavorable. (Note*: Favorable means in this context, with high profit and growth potential for the industry).
2. Those by which a company´s position in a sector may be judged to be strong or weak.
Shell Directional Policy Matrix explained. For our today´s purpose, please see the matrix information below:
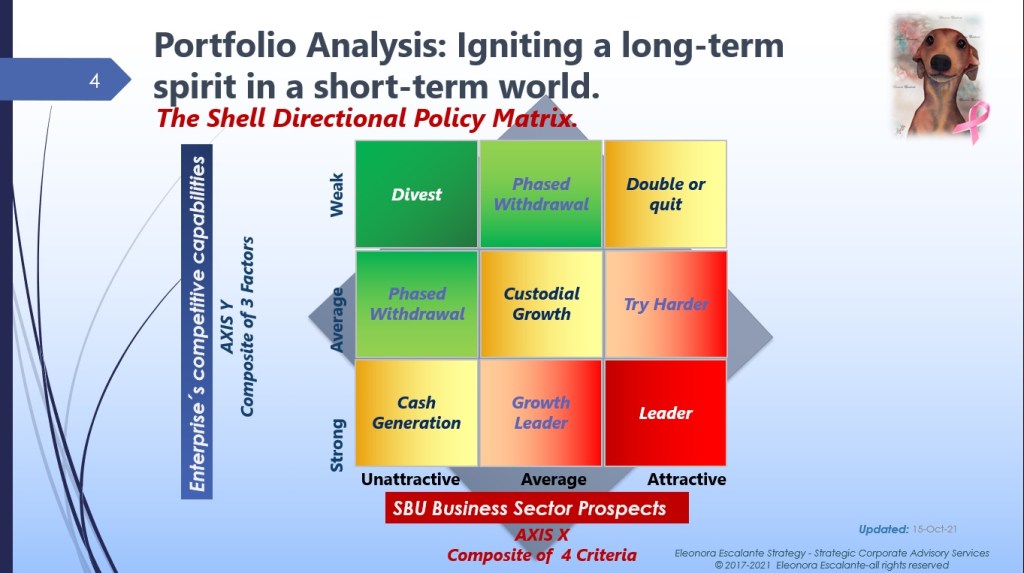
Study of the X-Axis SBU prospects for sector profitability. The X-Axis shows the business sector or each SBU prospect. The prospects are expectations by criteria by which the profitability for each SBU is judged. Shell listed for its SBUs at least 4 criteria:
| Criteria | Description |
| Market Growth Rate | Each industry from each SBU has different rating systems when it comes to market growth YoY (Year over Year). |
| Market Quality | Questions to consider when measuring quality related to profitability. If the 10 questions are answered with a “yes”, then this SBU would be counted with a maximum market quality rating. If the scale used is between 1 to 5, then the rating must be 5 for this specific case. List of questions: (a) Has the SBU a record of the high, medium, or low, or stable profitability? (b) Can margins be maintained when manufacturing capacity exceeds demand? (c) Is the product resistant to commodity pricing behavior? For example, in some sectors, notably those of a commodity type, profitability can be highly variable as profit margins reduce or expand over a wide range as market conditions swing between under-supply and over-supply. (d) Is the technology of production freely available or is it restricted to those who developed it? (e) Is the market supplied by relatively few producers? (f) Is the market free from domination by a small group of powerful customers? (g) Has the product high added value when renewed by the customer? (h) In the case of a new product, is the market destined to remain small enough and will not attract too many producers? (i) Is the product one where the customer has to change his formulation or even his machinery if he changes supplier? (j) Is the product free from the risk of substitution by an alternative (either substitute with other synthetic or natural materials), or substitutes using different aspects of the value chain? |
| Industry main constraints in the value chain, particularly input supply. | Any industry has limitations when it comes to the inputs material (raw supplies) used for processing or manufacturing the final product. Expansion of productive capacity is usually limited or constrained by the uncertainty of those inputs. If the uncertainty to find the raw materials is strong, then the rating will be lower than the average. If there is a surplus certainty of prospects for the inputs, then we can rate better than the average. |
| Environmental and Regulatory Aspects | The SBU prospects in terms of environmental regulation are influenced by the extent of restrictions on the manufacture, transportation, or marketing of the product. There are strongly positive or negative environmental or other regulatory impacts that must be taken into account in the rating of the business prospects. |
Scrutiny of the Y-Axis Company`s competitive capabilities. The Shell DPM identified three criteria by which an SBU´s position in a particular sector of the respective SBU industry may be judged as strong, average, or weak. The three criteria are:
| Criteria | Description |
| Market Position | Market percentage share of the SBU at the total market. Each SBU can be classified as a market share leader with a pre-eminent control of the market, as a major producer (where n company is a leader), or as a minor market share participant. |
| Production capability | This criterion is a combination of the main direct value chain components. Particularly all the processes of production, the capacity of plants, locations, and access to raw inputs. This criterion is the quality of the supply chain. |
| Product research and development | This is the most interesting feature of this axis. How innovation, design thinking, and development is measured? Product range and formats? Quality? Technical service? In rating, this factor, from a 1 to 5, the metric should be whether an SBU´s product R&D is better than, commensurate with, or worse than its position in the market. |
The Shell DPM was developed for the petroleum-based sector of the chemical industry. Nevertheless, the technique has been applicable to almost any diversified business with separately identifiable industries. Alternatively, the matrix can be used to display all the competitors in one particular business industry, since the method lends itself to evaluating competitors’ ratings as well as the one SBU of the company. In addition, the framework can be applied to a diversified shipping company, or to an engineering company offering a range of products and services. There are similarities between the GE matrix and the Shell DPM, but the business growth rate and timescale in the case of Shell were set to 10 years(3).
If you wish to download the material prepared for you today. Please click here:
Meaning of the 9-Cell Shell Directional policy matrix: To be continued.
Our song for today is composed and directed by Ennio Morricone. The soundtrack theme from the movie “The Mission” Concerto di Natale 2012 HD Basilica di Assisi. Enjoy.
Sources of reference utilized today to prepare the slides above:
(1) Hax, A. and Majluf, N. “The use of the Industry Attractiveness-Business Strength Matrix in Strategic Planning”. Interfaces. 1983. Vol 13 NO. 2.
(2) and (3) Robinson, Hichens, and Wade “The Directional Policy Matrix-Tool for Strategic Planning”. Long Range Planning. Vol 1L. pp 8-15
