

Portfolio Analysis: Igniting a long-term spirit in a short-term world (XIX). GE Matrix Denouement.
Hi to everyone who is reading this post today. It is our aim to finish the subject of the GE Portfolio matrix today. We consider that we have done our best to explain to you how to use and build the tool, but still, we have not landed into the analysis for formulating strategies at the corporate level.

October: Breast Cancer Awareness Month. Before proceeding further, I would like to explain why we choose the Pink Panther song, composed by Henry Mancini. We must go back in time to 1963, the year in which the movie “The Pink Panther”, directed by Blake Edwards was released for the first time. The soundtrack was in the hands of the jazz composer Mancini. If you can re-watch the film, -the gumshoe comedy managed by the French detective Jacques Clouseau (interpreted by Peter Sellers)-, please don’t expect the animated cartoon pink panther to show up during the film. The fictional animated character appears twice (only in the opening and closing credit sequences). In reality, the name of the motion picture “The Pink Panther” was based on the plot of a valuable world-famous jewel, a pink diamond that is stolen from a princess who was on holiday at an Alpine resort (2). The pink panther illustration was designed by DePatie-Freleng studio. And, Henry Mancini deserves his song in this saga. Currently, the pink panther character is more and more associated with the pink ribbon of October, the breast cancer awareness month.
Where we stand now with the GE Portfolio Matrix. One thing is to plot little circles based on calculations of composites based on a combo of weighted score mixtures for different variables. Another thing is to take decisions for strategic formulation.
One thing is to learn that the GE Matrix Y-axis or vertical measure shows us the external factors of our SBUs, factors that we can’t control; or to assess the X-axis measures based on the inherent SBU manageable factors that show a competitive advantage or not. Another thing is to outline the roadmap strategy to be pursued for developing each SBU after the forecasting for future positionings.
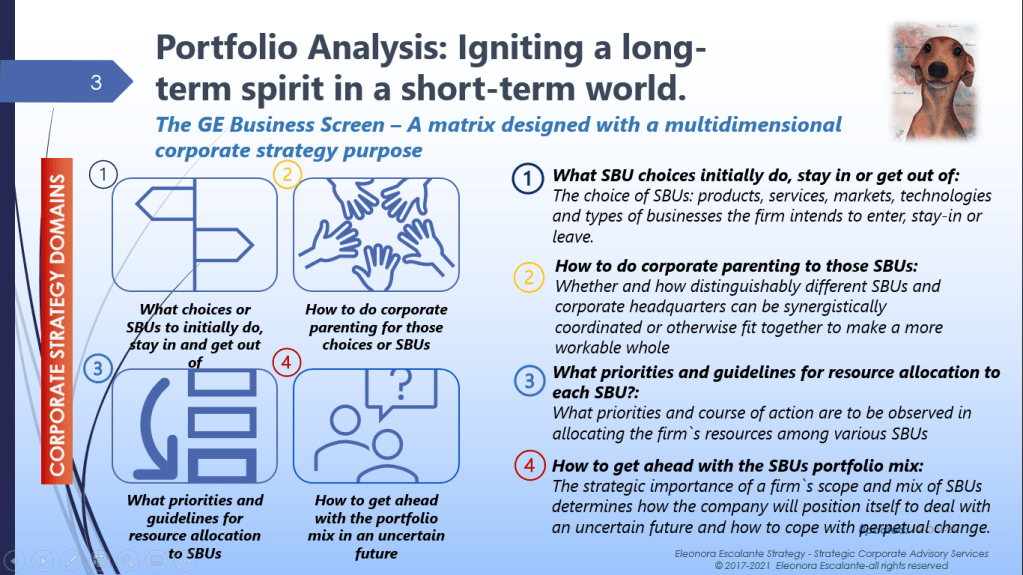
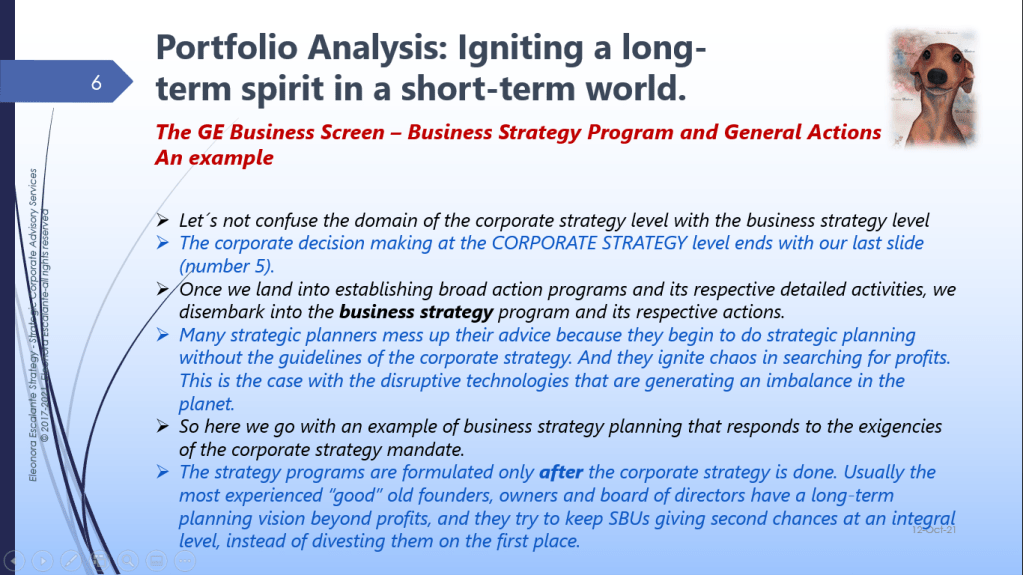
Please remember what corporate strategy in one single slide is. In consequence, once we decide about the SBU future at the corporate strategy level. The next step goes to the business strategists, with the formulation of action plans (strategic planning), and the investments priorities to track, for each and all SBUs.

Formulating strategies for each SBU.
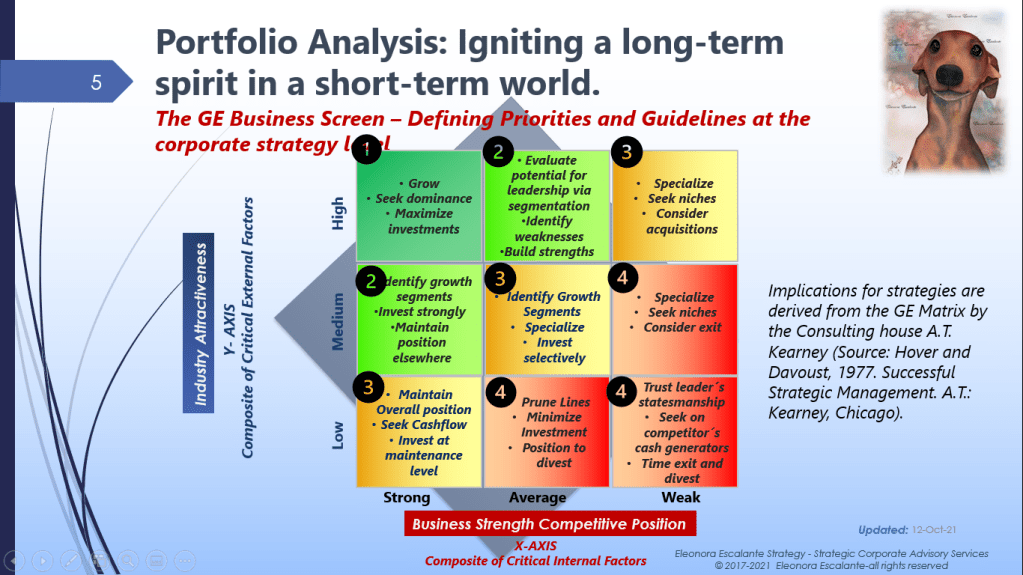
Once we plot the current and the desired position of our SBU in the matrix, then, we are clear that we must decide (at the corporate strategy level) and then, we must take action with activity/task implementation programs (at the business strategy level). See how it goes:
| Zone per Color | Corporate Strategy Decision (by GE Cell Prescription) | Business Strategy Broad or Wild Action Plans |
| Green | Invest to Expand and Grow | Explained at cells 1, 2 (see slide below) |
| Yellow | Maintain and hold on or Stay in. Selectivity to grow | Explained at cells type 3 (see slide below) |
| Red | Harvest and/or divest | Explained at cells type 4 (see slide below) |
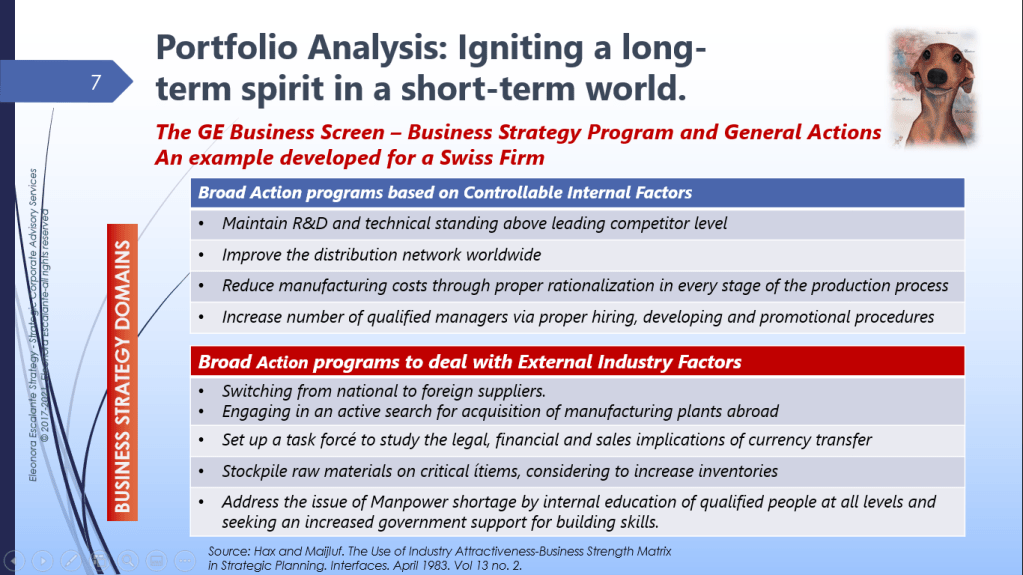
Please download the rest of the material that I have prepared for you today. It is self-explanatory. I have provided a very precise difference between what is the meaning of corporate strategy decision-making, and what is the meaning of business strategy broad plans that are displayed with specific actions. The business strategic plan is then given to each SBU manager. The business strategy plan is elaborated with the input of each SBU manager, but it must answer to the corporate strategy portfolio analysis.


Please download the last set of slides in PDF format, by clicking here:
Limitations of the nine-cell GE Portfolio analysis screen:
- It is a complicated thing to do it. The attractiveness of an industry can be assessed in many different ways, and the different factors can be assessed in many different manners. When assigning the weights, or when considering the ratings; each professional has its own background and experience. There are different results according to the consulting house hired and the teams experiences employed. For example. You can hire a consulting company that can assign the task of doing a portfolio analysis by two different teams, separated in between, each team not knowing what the other is doing; and both teams using the same company information resources. By the end of the exercise, you will have two different GE matrixes with different results.
- It can be cumbersome. Defining the numbers is one thing, but to navigate with a clumsy relative idea of what could happen in the future is not a simple analytical task. The predictions can vary radically when external radical situations as a pandemic, or a financial crisis can occur. The predictive ability of identifying competitive pressures and rivals‘ strategies underlies “astutely judging which one of the several alternative competitive strategies is likely to produce a greatest market success”.
- It can be ambiguous. By using a 9-cell matrix, this portfolio tool offers a richer and more mature perspective for guiding strategic actions to the managers of business development and growth, but it also introduces a complex net of factors that usually are measured implicitly by external advisors to the Board of Directors representatives. The SBU managers who implement the strategic action plans, even though they participate in the GE Matrix elaboration, usually do not understand all the issues involved and cannot reconcile diverging opinions coming from all the functional divisions reporting to them. Particularly SBU managers can´t translate well the way to develop standards lists of external and internal factors, because each SBU is a whole world apart from the other. How to build and plot a matrix with different factors for each SBU, it doesn´t work that way.
- SBU managers must be trained not just with analytical skills, but with economist, integral business concepts and ethical values applications, that they can use to valuate the importance different of business and corporate strategy appraisals. Managers need to connect the dots between what the corporate strategy requires, and the exploration of strategic issues of the SBU at the business strategy and functional strategy levels.
- The human, environmental and social well-being factors have always been dismissed as unimportant. When building the assessment of each SBU external factor at the industry attractiveness level (Y-Axis); the social wellbeing and human or community factors are not considered or usually not measured. Basically, all the matrix is blind when it comes to these crucial circumstances, and this has happened during the last 40 years. If this GE Matrix wishes to be utilized from now and then, the metrics of industry attractiveness and business competitiveness must dedicate several months and a DBR (Design-Based Research) mindset to begin to include all the social impact and human benefits or damages caused to clients. The SDG goals are a first intent to guide private corporations. The same happens with the CSR (Corporate Social Responsibility standards) In addition, the environmental and religious factors must appear in the list of factors as a key. For example, if a social media platform will replace the religious peaceful rituals and ethical values much required for community connivance all over the world, this factor has to be considered and judged before plotting the graph.
See you next Friday with a new episode on how the corporate strategy is made by using these frameworks. It will be the turn for the Shell Directional Policy Matrix. I will leave you with the marimba interpretation of Chick Corea and Gary Burton’s song “Armando´s Rhumba”. We will see why in our next episode.
Blessings and see you again soon. Thank you for reading to me.
Sources of reference utilized today to prepare the slides above:
(1) Hax, A. and Majluf, N. “The use of the Industry Attractiveness-Business Strength Matrix in Strategic Planning”. Interfaces. 1983. Vol 13 NO. 2.
(2) https://www.britannica.com/topic/The-Pink-Panther
(3) https://www.bozoparadzik.com/biography.html
Disclaimer: Illustrations in Watercolor are painted by Eleonora Escalante. Other types of illustrations or videos (which are not mine) are used for educational purposes ONLY. Nevertheless, the majority of the pictures, images, or videos shown on this blog are not mine. I do not own any of the lovely photos or images posted unless otherwise stated
