
Leg 5. From Guangzhou to Hong Kong (VII). Done!. Industry Evolution Summary and Conclusions. We are ready to depart to Auckland.
Good Morning! Hope we are thriving in all our activities for today. The six Volvo Ocean Race 2017-2018 teams are now in Leg 6, at full speed sailing to Auckland. We are also finishing Leg 5 today. Yeeeeey! Viva!!! Moreover, directly and without any stopover, we will depart to New Zealand today. As mentioned previously my aim is to reach the rest of the fleet. We are 13 hours behind the rest, and we have to be ready for this difficult and dangerous 6,100 nautical miles to Auckland.

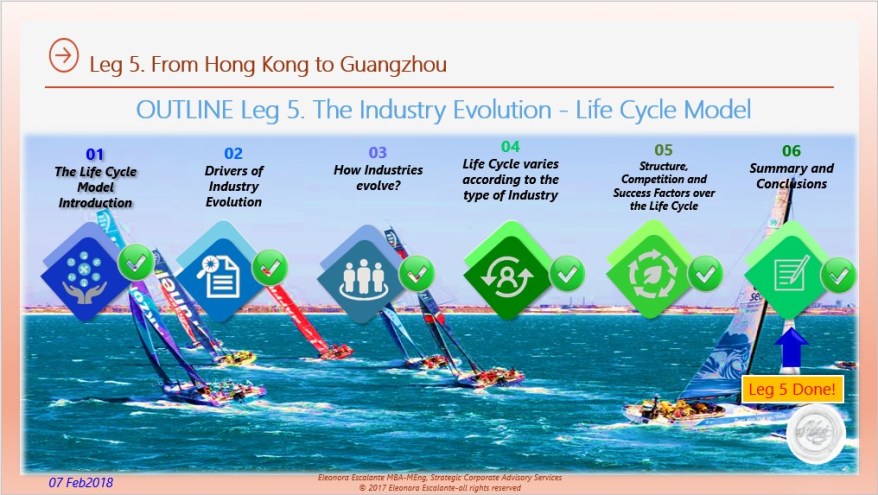
Summary and Conclusions Leg 5.
- We started Leg 5 with the purpose of going step by step digging deeply into the theme of Industry Evolution and Life-Cycle Curve patterns. Each industry has a particular pattern of Life-Cycle Curves.
- When we wish to build an Industry Life-Cycle Curve, we aggregate or sum the sales of all the specific industry participants and plot them over time (by year, quarter, etc). We can use any sales, revenues or profit indicators in the vertical axis. In the horizontal axis, we have to use time indicators (years, months, quarters, etc.).
 We visited a classification system used in the USA, called NAICS (North American Industry Association System)which give us an overview of how are industries organized by country. It also helps us to understand the boundaries of our industry sorting. At the same time, it is standard to use NAICS labels when defining a specific industry. Each country (hopefully regions) should have an Industry Assorting System which has to be updated every year. It is a priority for business owners and the economy stakeholders to educate ourselves about this. Each of the industries listed in NAICs has a specific life-cycle curve or S-Curve. Remember the Life Cycle model is a simplified characterization of the principal stages in an industry´s development. And we can´t generalize the patterns. There are serious research papers which have identified at least 16 types of life cycle curves for different industries.
- There are two main factors that can be identified as fundamental to driving industry evolution: Demand Growth and the Production and Diffusion of Knowledge.
- The Life Cycle is divided into four phases: Introduction, growth, maturity, and decline. Each of these stages is linked with particular structural features that influence the nature of competition, and most important determine key success factors.

- Each industry is in a constant stage of evolution. New competitors, new technologies, new process innovations, international expansion and trade locations, value chain challenges and changes, external recession or economic downturns, can affect our S-Curve shape, duration of each of the life-cycle stages and the emergence of new or emerging business models which replace the previous industry S-Curve.
- We went over each of the main industry characteristics and provided common elements for each of the phases. We visited the following characteristics: Demand, Technology, Products (type, differentiation, standardization), Manufacture and Distribution, Trade and Competition. For each of these industry peculiarities, we identified specific examples with the hope to illustrate the topic at plenitude.
-
Finally, Professor Robert Grant has stated: “Classifying Industries according to their stage of development fulfills three purposes: (1) First, it acts as a shortcut in strategy analysis. (2) Second, it requires comparison with other industries. This is the basis for a deeper understanding of its structure, competitive character and sources of competitive advantage. And (3) Third, it directs attention to the forces of evolution within the industry and encourages us to look ahead to the future circumstances of the industry. The best strategists are always ahead of the game. We know we can´t generalize, “we can recognize that industries do not follow a common development path”.

Figure Source: Price of Convenience: Dynamics of Adoption Attitudes and Privacy Sensitivity Over Time. Ng-Kruelle, Swatman, Rebne & Hampe
 It is critical to help companies and business owners to evolve. Firms which have been successful at introduction or growth stages, often are not ready for the maturity stage, because the resources and capabilities which help them previously are unlikely to be successful at a next stage. In addition, when business owners foresee a potential decline in their own industry, strategists help them to meet the circumstances of the future and help them to reshape their products and services to meet the new challenges required by emerging generations.
- Finally, the life cycle is the most common approach to industry classification used in strategy analysis. But there are other bases of classification available. For example, industries can be classified by type of customer, by the type of resources used, by the geographic scope of the industry, etc. Each leading consulting firm has designed additional frameworks. Including myself.

This is all for today. On my next post, we will start racing Leg 6. Thank you so much for your patience and consideration. I promise we will catch up the rest of the teams as quickly as we can.
Source References:
Disclaimer: The content and presentation slides shown on this blog are prepared by me. Nevertheless, all the pictures or videos shown on this blog are not mine. I do not own any of the lovely photos posted unless otherwise stated.
