

Revenge Strategy: wasting the power of your hate on the guiltless (XLVIII). Why did China and the USA “seem” to be playing to hurt each other through a revenge commercial strategy?
Have a beautiful Wednesday. Today we will continue with our journey between China and the USA trade war. I will answer our 4th outline question: Why did China and the USA “seem” to be playing to hurt each other through a revenge commercial strategy?

“Love at first sight”. The love between a horse and a little girl. A watercolor exercise by Eleonora Escalante. Canson 300 GSM Paper. Size: 9″ x 12″.
I would recommend you to download the sovereign rating reports from China and the USA. As I mentioned in one of my last posts, you can find this information in the following credit rating agencies websites:
- Fitch
- Moody´s
- Standard & Poors
- DBRS-Morningstar
The World Bank has also a source of plentiful information that I recommend to visit when it comes to economic, trade and business comparisons. There is another source of such a vital substance that I frequently read, and that is The Economist. They have a resourceful bibliotheque of publications inside The Economist Intelligence Unit website. Often I also visit the OECD website for the most updated assemblage in relation to the most developed countries. At the same time, some prestigious universities have done beautiful work throughout these years to keep economic, trade and business data on the tip-top state. University research centers are a source of wisdom. The most prestigious universities on the planet are able to attract funds to set up research centers in every single discipline you can imagine. Feel free to visit all these source websites provided to get an overview of both economies.
Instead of preparing a set of slides with the economic-trade-business indicators; I will stick my ordnance to share some ideas from the analysis I have read from Standard & Poors’ article “Deep-Seated U.S.-China Tensions Could Threaten Global Sovereign Ratings”, published on 12-Nov-2019.
- Disputes between the U.S. and China over trade, technology, investment, and other issues have created greater uncertainty for the world economy, lowering its growth prospects. S&P Global economists recently lowered their forecast for U.S. GDP growth to 2.3% in 2019 (from 2.5% previously) and 1.7% in 2020 (from 1.8%), due in part to such uncertainty.
- The U.S. and China Sovereign Credit Quality ratings have not been impacted yet. Both countries have honored their debt payments, and the U.S. has kept its AA+/Stable/A-1+ grade. China still has its A+/Stable/A-1. Both countries have been able to sort out and mitigate the short-term economic costs of their bilateral disputes thanks to the size of their domestic economies. Domestic demand in both countries has compensated the uncertainty. The wealth, resilience, and diversity of their economies have also sustained sovereign creditworthiness in both China and the U.S., despite the threatening of potential economic deceleration. However, if the US and China don´t diminish their recent tensions, for the long run, this could also dampen GDP growth in the U.S. We expect that, despite large projected fiscal deficits in the near term, the U.S. government will enact countervailing measures to begin addressing longer-term fiscal challenges over time. A failure to do so, especially in the context of prolonged and unexpectedly weak GDP growth, could lead to a negative rating action to the US.
- According to the Global Value Chain Development Report 2019, more than two-thirds of world trade goes through global value chains, which rely on the flow of goods, services, capital, technology, and management practices across borders. China is the top center of sophisticated supply chains that link it with most of its Asian neighbors, while the U.S. is linked in a similar manner with its North American and Central American neighbors. In the case of China, for information and communication technology products, about 66% of intermediate imports in China factories serve as inputs for Chinese exports (and most of the inputs come from other surrounding Asian countries). A potential increase in recent restrictions on technology transfers, investments, and sensitive exports by the U.S. could disrupt the development of new technology and products, perhaps by splitting U.S.-led and China-led networks of production from each other.
- Any little change in the global value chain’s operational model in China makes them vulnerable to weaken the “ global trade confidence” in general. Disruption of global supply chains, as well as falling business confidence in general, could have widespread repercussions on GDP growth, commodity prices, and currencies, potentially weakening some sovereign ratings. Weaker commodity prices could lead to lower GDP growth and a weaker external profile for many exporters in South America and Africa. Substantial and abrupt changes in exchange rates could greatly affect the currencies of countries beyond the U.S. and China, potentially damaging some Asian trading partners closely linked with China through supply chains or competing with China in some products.
- The U.S. administration has used trade policy and restrictions on investment and technology transfers in an effort to improve operating conditions for U.S. firms in China, seeking to change Chinese rules for market access, intellectual property, mandatory technology transfers, subsidies, and the role of state-owned enterprises. The conflict goes beyond the U.S.’s bilateral trade deficit with China to encompass wider strategic concerns. The tensions between the two countries are likely to persist for many years since the American demands impinge on critical aspects of China’s governance and development strategy.
- The relationship between the U.S. and China is critical for global economic and political developments. The two countries together account for about 40% of the world’s GDP.

Deep-Seated U.S.-China Tensions Could Threaten Global Sovereign Ratings. Written by Joydeep Mukherji and Roberto H Sifon-Arevalo. S&PRatings.
- The U.S. and China have accounted for nearly 45% of world GDP growth in the past five years, with China contributing a larger share. Any reduction in GDP growth in either country will soon spill over into lower world growth, directly and indirectly affecting all other countries.
- The two countries have accounted for over 20% of global exports of goods and for nearly 20% of services in the past five years. Any material changes in their bilateral trade patterns, or a decline in bilateral trade, would also substantially affect global trade volumes and patterns, including cross-border supply chains.
- China and the U.S. also dominate global manufacturing. As shown in the next S&P Chart the two countries account for nearly 45% of the value-added in the manufacturing sector globally, a higher combined share than a decade ago. The two countries also account for just under 15% of the total outward flows of foreign direct investment (FDI). A disruption in their bilateral ties would redirect, or likely reduce, FDI inflows into much of the rest of the world.

Deep-Seated U.S.-China Tensions Could Threaten Global Sovereign Ratings. Written by Joydeep Mukherji and Roberto H Sifon-Arevalo. S&PRatings.
Now that you have seen the comments from S&P, let me show you what I wrote in the most simple language I could find for you. I wrote this, before clicking the words of the experts. In other words, I formulated the following comments for you (before I went to read the Standard and Poor´s article).
Why did China and the USA “seem” to be playing to hurt each other through a revenge commercial strategy?
China and the USA have finally promised to stop the trade war. China has committed to adjusting its boat compass on certain features of its trade, and the USA has won others. Both seem to be contented about it.
Two equipotent countries with aggregate trade dominating the world are definitely able to trigger a global recession if they wish, through a genuine revenge commercial strategy.
The US-China’s existing love affair since 1979 (as I defined it metaphorically) has left them intertwined given the conceptual operation model of both countries. Both nations have used and implemented global value chains to create economic growth. Michael Porter´s value chain tangled China with the US and the world, in such a strong codependent trade model that even if President Trump desires to cut the ties with China, it is almost impossible to do it without triggering a global recession. We are all connected by now.

That is why I wrote that China and the USA seem to be playing to hurt each other through tariffs and protectionist measures during the last 17 months. Their tariff moves did not hurt crucial industries harshly. The core export-import trade between both countries was not altered in the key industries of their trade. Chinese global shipments from 2018 to the US have been mainly in electrical machinery and equipment, machinery including computers, furniture, bedding, lightings, and plastics.
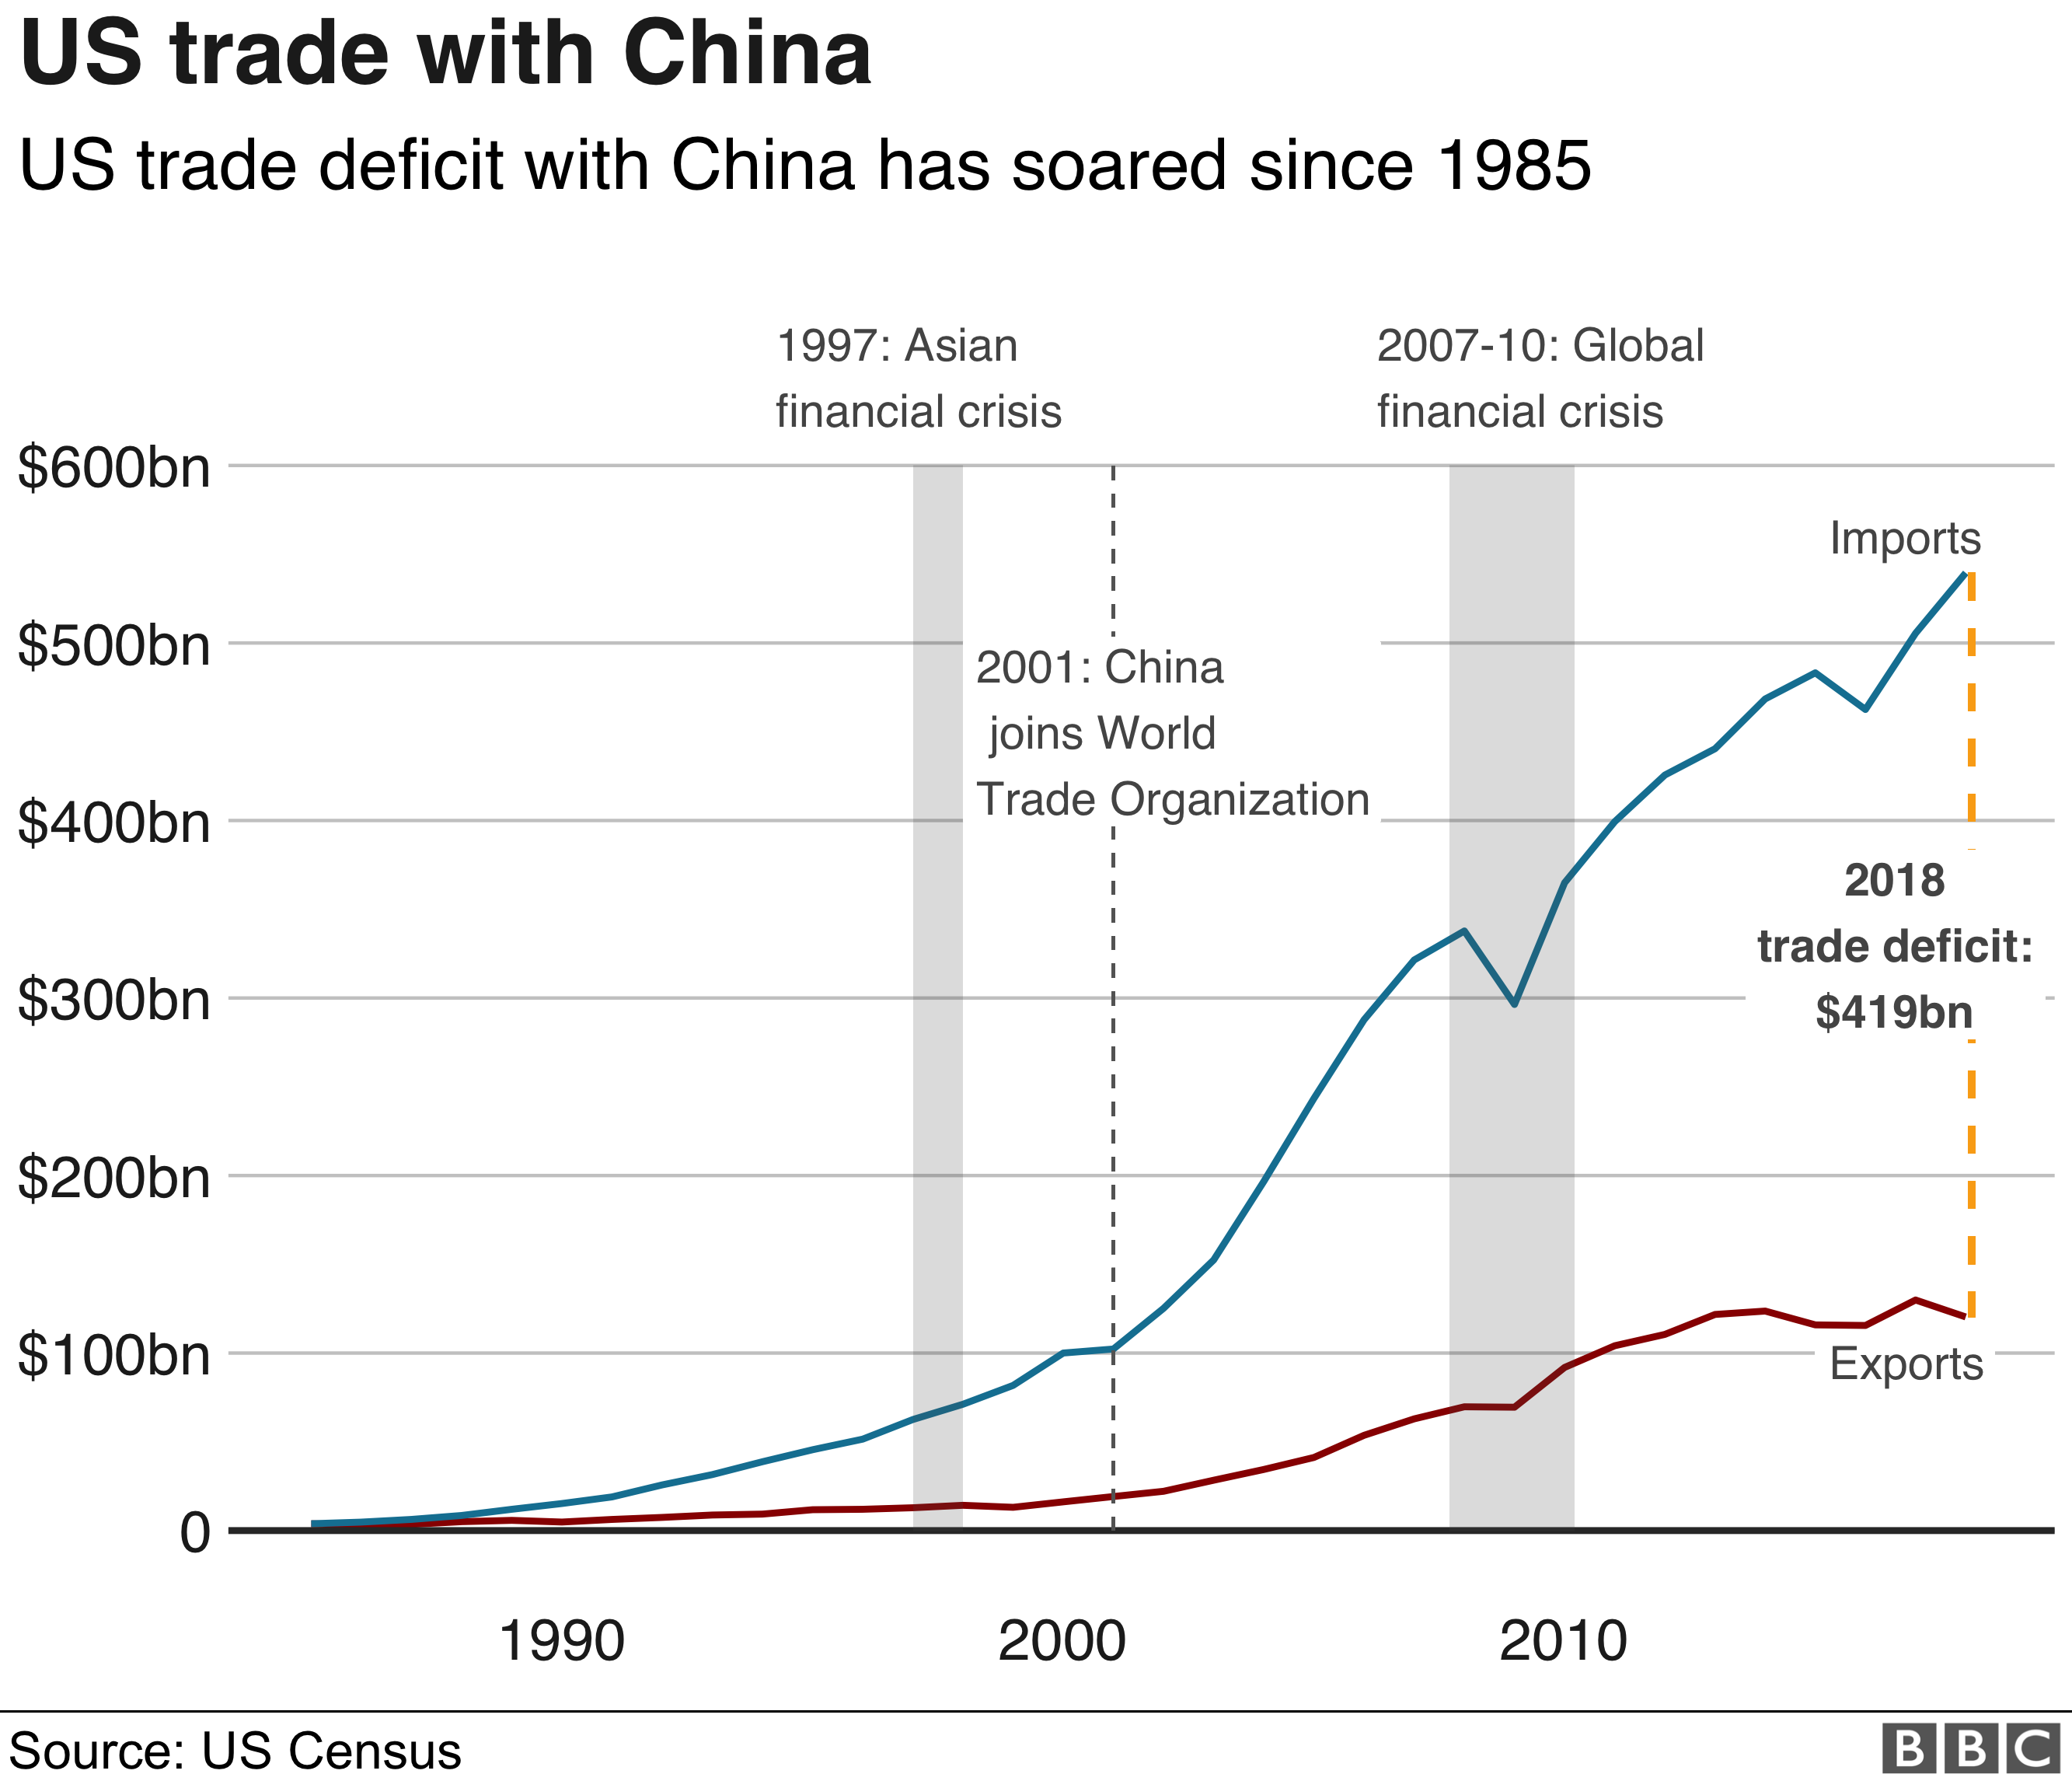
The key big issue here is the US Trade deficit, and Americans wanted to solve this problem.
Once China and the US finish the deal to stop this current trade war, I wouldn´t dare to state that both countries will not eventually re-start a new trade war in the future (once they end this one). Hopefully, they won´t. Both countries have comprehended since the beginning of its trade conflicts, which is the maximum limit for each, both have set up their trade boundaries. Both countries cognize that none of them will survive in the scenario of a global recession either. A domino effect will hurt other countries too. The global value chain model will be affected, and both nations will lose more than what they will win.

Low-cost business nation models based on global value chains are so tangled in every single section of the chain that there is no room for trade wars. China has been the expert on low-cost manufacturing (regardless of the type of product). Once you understand that China´s successful manufacturing model is based on every single penny it can save in each and all the components of its value chain, you are ready to canvas that the key for profits in the case of China is the volume of products they are able to sell. The more China sells the merrier. The markup is done by the magnitude of products sold (how many units of trade goods are sold-out), the quickest as possible to reduce inventory costs. Any reduction in the number of goods sold can hit local China producers as much as multinationals of US origin produced in China. I believe once the US Trade deficit with China is resolved, the US will be happy again.
On December 15th (just 4 days ago), the U.S. and China have agreed to the first phase of a broader trade deal, bringing a temporary calm to their escalating trade war. The 86-page agreement includes chapters on intellectual property, technology transfers and expanding China’s import of U.S. agricultural goods.
This is it for today, I will continue writing over the week. Remember this saga will finish before Christmas. Thank you.

Sources of information utilized to write this publication:
http://www.worldstopexports.com/chinas-top-10-exports/
https://www.visualcapitalist.com/mapped-worlds-largest-exporters-in-2018/
https://ustr.gov/countries-regions/china-mongolia-taiwan/peoples-republic-china
https://unctad.org/en/PublicationsLibrary/ditctab2019d2_en.pdf
Disclaimer: Illustrations in Watercolor are painted by Eleonora Escalante. Other types of illustrations or videos (which are not mine) are used for educational purposes ONLY. Nevertheless, the majority of the pictures, images or videos shown on this blog are not mine. I do not own any of the lovely photos or images posted unless otherwise stated.
