

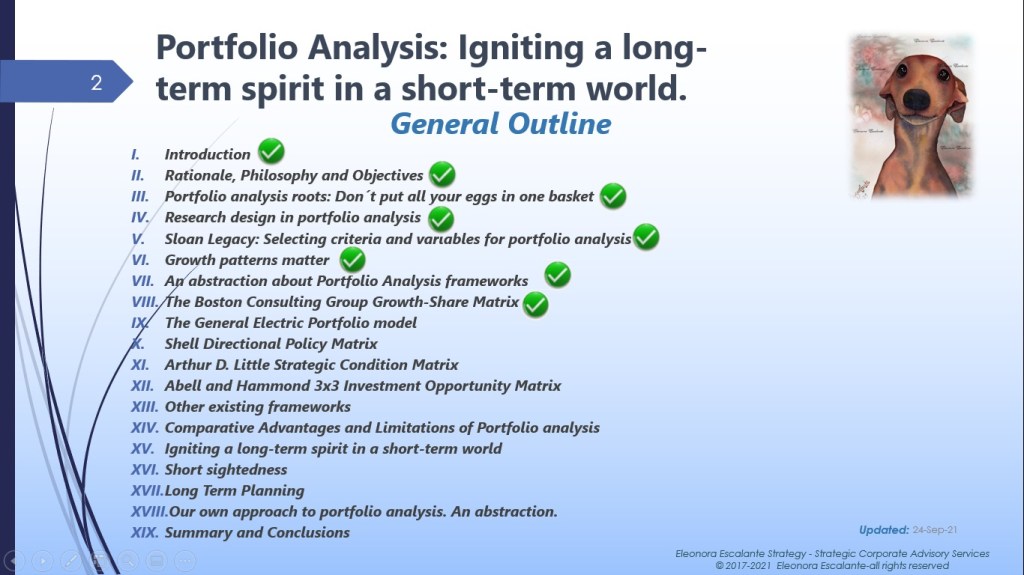
Portfolio Analysis: Igniting a long-term spirit in a short-term world (XIV). BCG Matrix explained
Walking on sunshine
Katrina and the Waves, 1985.
I feel alive, I feel the love
I feel the love, that’s really real
Walking on sunshine. Have a beautiful Friday. Again, we are going to finish the month of September soon. We will begin with the reassemble of our last song shared. This song was released when I was a teenager, so I am sure that Gen X folks get it immediately. Once we put love in the center of our endeavors, decision making, and business portfolio analysis, will be performed differently than right now. We will learn to treasure the importance of belonging to a “middle-class” only when we learn to open our eyes to the way in which management tools are effectuated. Furthermore, we will always be “walking on sunshine”, enjoying how to be patient, and comprehending that all our business models are not to be made automatic, squeezing all in a Smartphone, but considering how can we grow and learn with our team members to keep a balanced life of a blessed “middle-class” (Defined as families earning between US$28,800 to US$125,700 a year). Please do not accept the global standard of a middle-class income below US$ 20 pppd ((pppd: means income per person per day for a family of four). Anything below that US$20 pppd for a family of four benchmark, is pure low-class living in poverty, and we can´t accept anything below that for the Middle-class range, at least not from now and then.
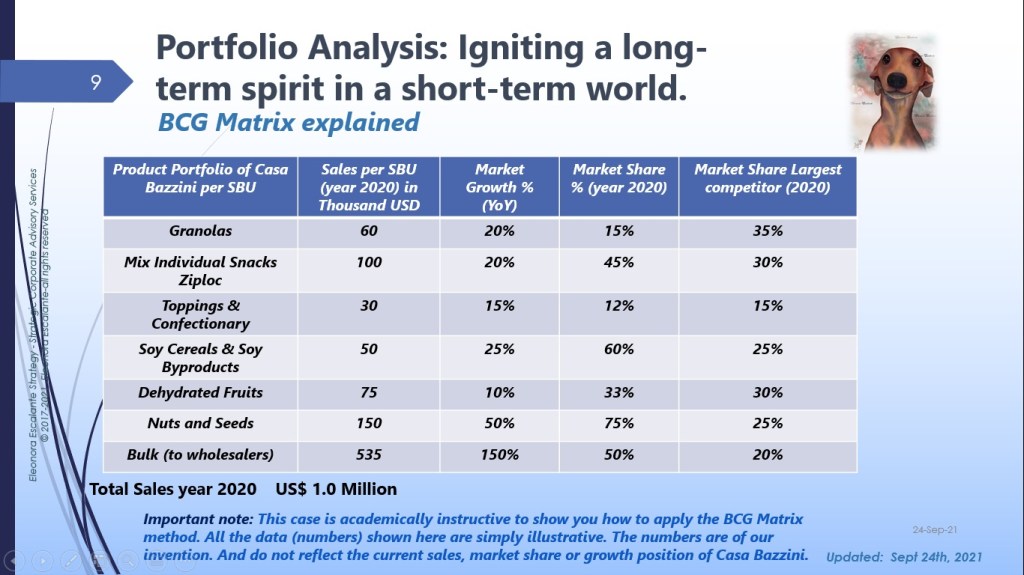
Today, it is my aim to show you an example of how to make and analyze the results of the BCG Growth-Share Matrix.
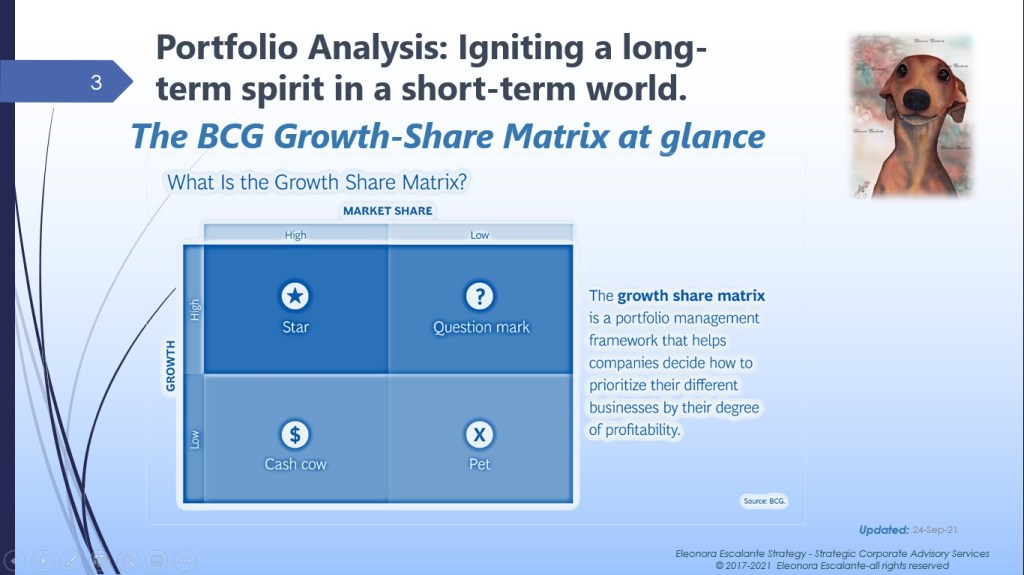
What is the BCG Growth-Market Share Matrix? (1)
First, this is a tool developed in the mid-1960s by Bruce Henderson, Boston Consulting Group, one of the leading consulting houses in the world. It is used to assess the position of each SBU in terms of different growth rates and different market shares (quantified in terms of its relative market share to the leading competitor of the SBU industry).
Methodology of the BCG Growth Market Share Matrix (2)
There are some steps to follow when applying this method.
Step number 1. Dividing the company into strategic business units (SBUs) and assessing the long-term prospects and key drivers of each SBU, such as sales past results (year over year), market share, and the leading competitor market share.
Step number 2. Comparing the SBUs against each other by means of a matrix (a graph) that indicates the relative prospects of each.
Step number 3. Developing strategic objectives with respect to each SBU
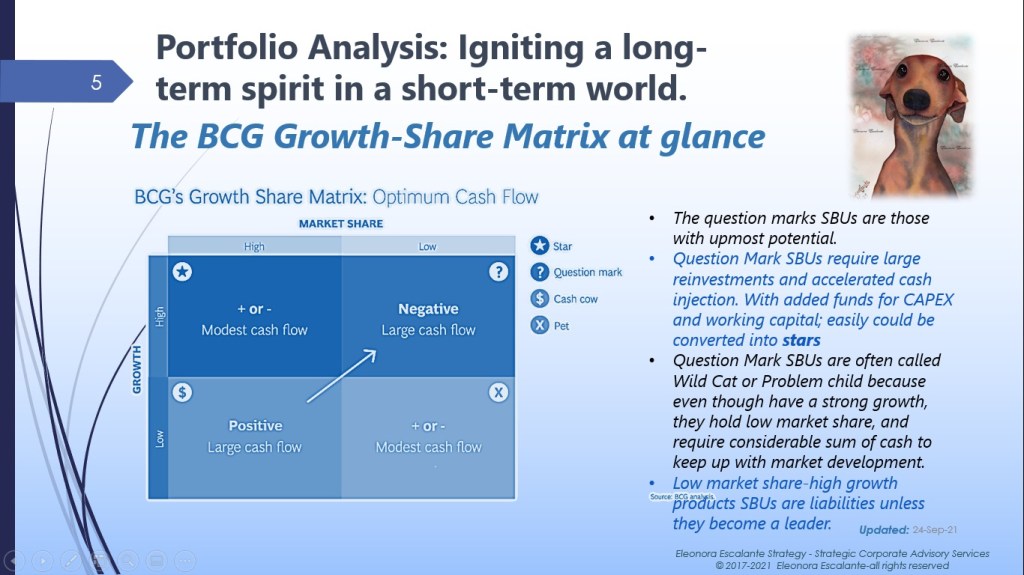
Rules that determine the cash flow of the SBUs. According to BCG, there are four rules that determine the cashflow of an SBU (3):
- Margins and cash generated are a function of a market share. High margins and high market share go together. This is a matter of common observation, explained by the experience curve.
- Growth requires cash input to finance added assets (working capital and capital expenditures). The added cash required to hold market share is a function of growth rates.
- High market share must be earned or bought (acquiring other competitors). Buying market share requires and additional increment of investment.
- No product market can grow indefinitely. The payoff from growth must come when the growth slows, or it never will. The payoff is cash that cannot be reinvested in that product.
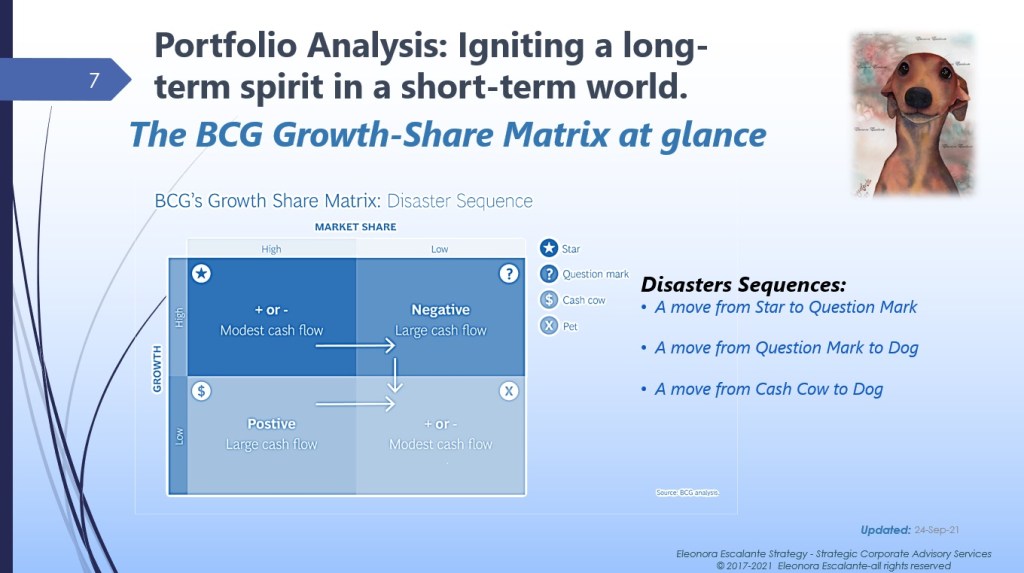
BCG Growth-Market Share matrix explained.
Let´s visit the material prepared for you today.


If you wish to download the last set of slides in PDF format, please click here:
In our next post, we will continue with the inferences and analysis from the last graph of the slides. After plotting each bubble that represents an SBU, it is clever to analyze the meaning for each of them. See you next Tuesday. Blessings and thank you for reading to me.
Our song for today is “Money for Nothing”. Guess why we selected it? Enjoy!
Sources of reference used today:
(1) https://www.bcg.com/about/our-history/growth-share-matrix
(2) https://www.semanticscholar.org/paper/Portfolio-Analysis-Models%3A-A-Review-Udo-Imeh-Edet/9518a35f9050a95d77e34719ad2a43f12737f264
(3) https://www.bcg.com/publications/1970/strategy-the-product-portfolio
(4) http://casabazzini.com/
Disclaimer: Illustrations in Watercolor are painted by Eleonora Escalante. Other types of illustrations or videos (which are not mine) are used for educational purposes ONLY. Nevertheless, the majority of the pictures, images, or videos shown on this blog are not mine. I do not own any of the lovely photos or images posted unless otherwise stated.
