
Leg 5. From Hong Kong to Guangzhou (II): Drivers of the Industry Evolution.
Good Afternoon for you. Today´s topic is “Drivers of the Industry Evolution”. As far as the Volvo Ocean Race 2017-2018, the teams are going to stay in Hong Kong until next week. I decided to continue writing meanwhile their stopover in Hong Kong, that is why you see, I have started my leg 5 race to Guangzhou previously.
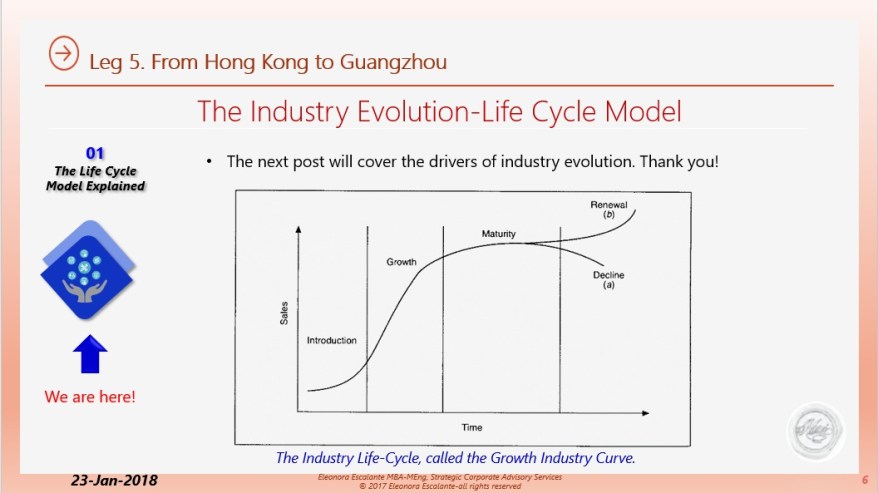
 As mentioned in our previous post, the Life Cycle in an industry´s growth over time is generally characterized as an S-shaped growth curve. Why? Because of two factors: Demand Growth and Creation-Diffusion of Knowledge.
- Demand Growth:
“The life cycle and the stages within it are defined primarily by changes in an industry’s growth rate over time. The characteristic profile is an S-shaped growth curve.
- In the introduction stage, sales are small and the rate of market penetration is low because the industry’s products are little known and customers are few. The novelty of the technology, small scale of production, and lack of experience mean high costs and low quality. Customers for new products tend to be affluent, innovation-oriented, and risk-tolerant.
- The growth stage is characterized by accelerating market penetration as technical improvements and increased efficiency open up the mass market.
- Increasing market saturation causes the onset of the maturity stage. Once saturation is reached, demand is wholly for replacement.
- Finally, as the industry becomes challenged by new industries that produce technologically superior substitute products, the industry enters its decline stage“.
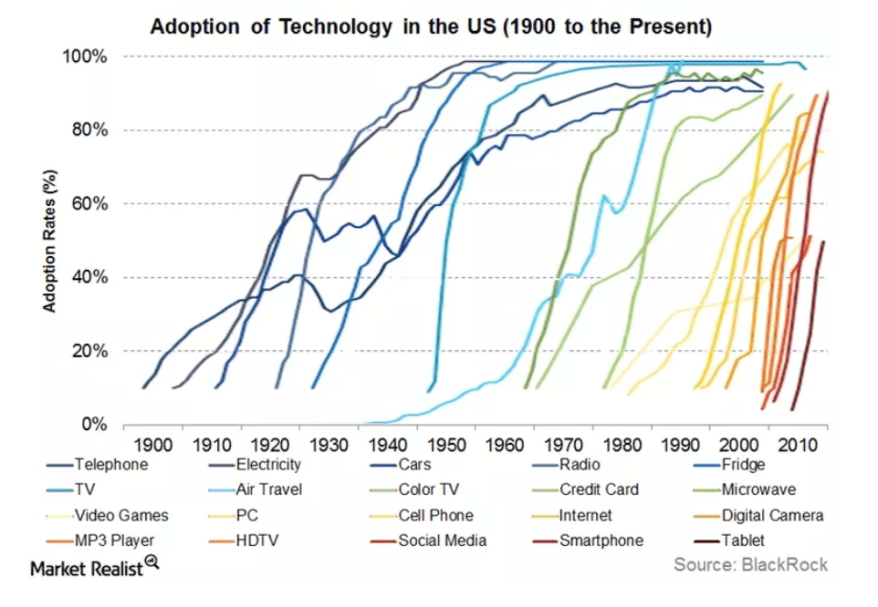
Professor Grant has taught us: In the Introduction stage, “At the beginning “the industry´s products are little known and there are a few pioneering firms and customers. The novelty of the new product, new technology and lack of economies of scale or lack of experience tends to be low because products have not benefited from the multitude of incremental innovations and modifications that accompany the passage of time and widespread use”. Market penetration is initially slow. The customers for new products tend to be high income and innovation oriented. They also tend to be risk-averse because of the danger of buying early is not just that one pays a high price but the one buys into a technology that is displaced”. Let´s see this graph to understand the concept of S-Curves:
The last graph shows us several S-Curves over time from the year 1920 up to the year 2000. The vertical axis is the % of adoption in the USA. We can follow each of the graphs of different products. For example, there is a different S-Curve for the telephone (in color cyan) in comparison to the radio AM (color yellow) or the TV ( color pink). With the emergence of new technologies since the mid-70s, we can see many S-curves of different technologies emerging such as the internet, the cell-phone, Cable TV, etc. This graph is very interesting because we can see how the different inventions have been adopted (bought) over time, and we can see how the S-Curve patterns have changed too.
“When the product technology become standardized, product prices begin to fall. The market penetration accelerates. And this is the growth phase. The growth phase starts when the demands increase, and when the ownership of the different technological devices from higher income customers shift to the mass market”. Returning back to the latter graph: We can observe, that all growth phase durations of the latter S-curve technologies between 1975 to the year 2000 (reaching up to 70%-80% adoption) have a duration of 10 years average, and that is the turning point for the mature phase. “As market saturation is approached growth of demands slows as new demand gives way to replacement demand. Once saturation is reached, demand is wholly from replacement, either direct replacement (customers replacing old products with new products) or indirect replacement (new customers replacing old customers). Finally, as the industry becomes challenged by new industries, that produce technologically superior substitute products, the industry enters its decline stage”.
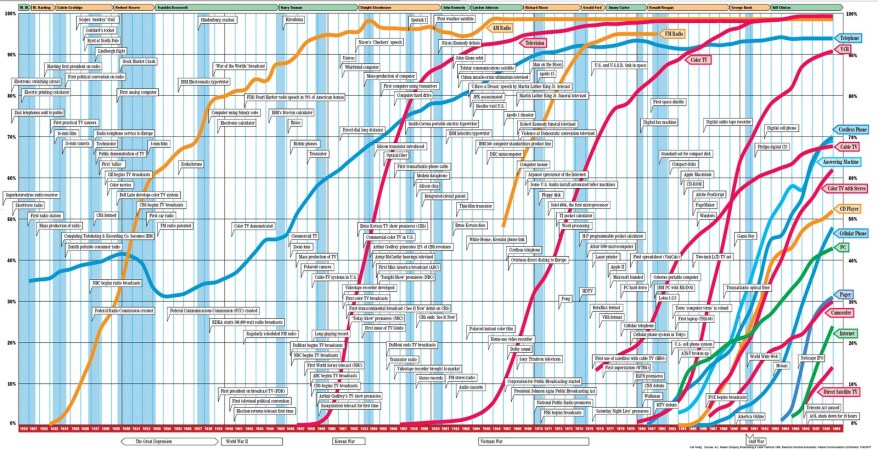
We can see another set of S-Curves by Nicholas Felton, from the New York Times: 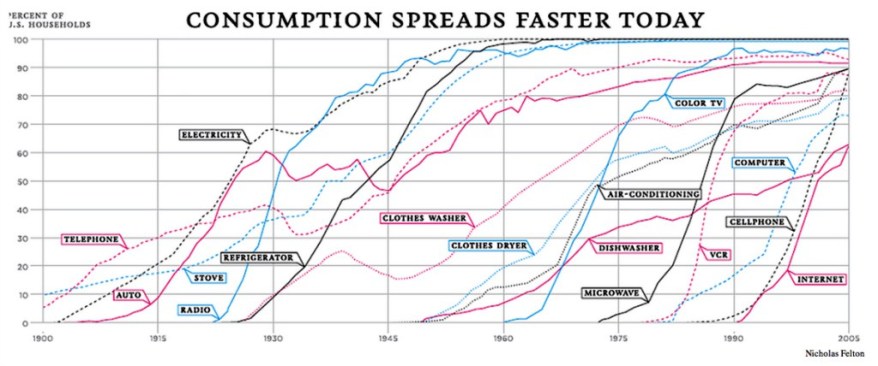 Felton analyzed that sales of these technologies are faster and faster today. “The length of time it takes for a technology to become hilariously obsolete is shrinking. In the late 19th century, inventions took three to five decades to be adopted by a quarter of Americans compared with the internet which got there in less than one decade”. Moreover, Kelsey Mckinney in 2014, states that “not only is technology being adopted by American households more quickly, but there is more technology to adopt”. During the last 35 years, there have been at least three times more technological inventions than before, which have grown quickly in sales and adoption, and this data doesn’t even include inventions from the 21st century.
2. Creation and Diffusion of Knowledge:
The second driver of the industry life cycle is knowledge. New knowledge in the form of product innovation is responsible for an industry’s birth, and the dual processes of knowledge creation and knowledge diffusion exert a major influence on industry evolution.
In the introduction stage, product technology advances rapidly. There is no dominant product technology, and rival technologies compete for attention. Competition is primarily between alternative technologies and design configurations. An example of this is the evolution of the TV display industry:

Let´s see Samsung evolution (which represents the TV Display industry evolution for this example). The year I was born (1970) Samsung started selling the TV in black and white, the CRT technology which then evolved into a DLP technology. “And in the early 2000s, the major TV Makers recognized that LCD was the future, and made huge investments to convert their CRT TV sales to LCD TV Sales”. In the year 2007, LCD TV Sales surpassed its CRT-based for the first time, and then next the OLED technology has taken place. For more information about TV technical concepts and evolution: Read the article TV Technology demystified. Independently of Samsung Recent Scandals (I don´t think this is a subject for today); through Samsung we can observe the TV Industry evolution. Samsung competitors such as LG, Panasonic, Sony, Phillips, and other companies all together shape the TV display Industry. The TV Display Industry will continue to evolve, and I will continue using this industry as an example during the next posts.
The competitive process involves a selection of the more successful from the less successful approaches, and typically, a dominant technology and design configuration emerges.
This is all for today. For my next post, we will continue with the topic: How Industries evolve? Thank you. Please remember our outline for Leg 5. See you soon!
Source References:
http://www.rapidshift.net/transition-to-evs-set-to-climb-the-s-curve-in-the-next-decade/
https://www.vox.com/2014/4/20/5624018/should-technology-define-generations
http://www.wrsc.org/attach_image/adoption-chart
https://evobsession.com/revolution-will-main-drivers/
https://www.lifewire.com/tv-technology-demystified-1847341
http://www.wiley.com/WileyCDA/WileyTitle/productCd-1119120845.html
Disclaimer: The content and presentation slides shown on this blog are prepared by me. Nevertheless, all the pictures or videos shown on this blog are not mine. I do not own any of the lovely photos posted unless otherwise stated.
