

Leg 5. From Hong Kong to Guangzhou (IV). Each industry has its own life-cycle curve.
Good afternoon!
Hope you are well, happy and thriving in all your activities today.
On this post, we will learn that each industry has its own life-cycle curve. As usual, I am using the textbook from Professor Robert Grant, “Contemporary Strategy Analysis” 8th edition, as the main reference for today.
As I have mentioned previously, the life-cycle curve varies from industry to industry. To what extent do industries conform to this life-cycle pattern? To begin with, the duration of the life cycle and the various phases of it varies greatly from industry to industry:
- The introduction phase of the US railroad industry extended from the building of the first railroad, the Baltimore, and Ohio in 1827, to the growth phase of the 1870s. With the growth of road transport, the industry entered its decline phase during the late 1950s.
- The introduction stage of the US automobile industry lasted about 25 years, from the 1890s until growth took off in 1913–1915. Maturity set in during the mid-1950s, followed by a decline during the past decade.
- In personal computers, the introduction phase lasted only about four years before growth took off in 1978. Between 1978 and 1983, a flood of new and established firms entered the industry. Toward the end of 1984, the first signs of maturity appeared: growth stalled, excess capacity emerged, and the industry began to consolidate around fewer companies; however, growth remained strong until the end of the 1990s.
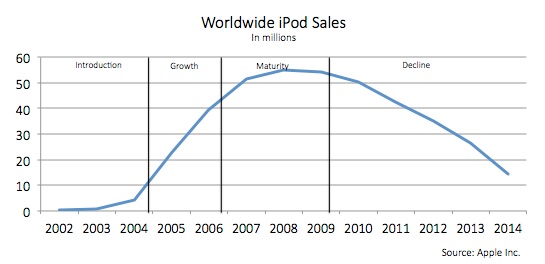
- Digital audio players (MP3 players) were first introduced by Seehan Information Systems and Diamond Multimedia in 1997. With the launch of Apple’s iPod in 2001, the industry entered its growth phase. By 2009, slackening growth indicated entry into the mature phase. After the year 2009, the iPod began its decline phase too.

“Over time, industry life cycles have become increasingly compressed. This is especially evident in e-commerce. Businesses such as online gambling, business-to-business online auctions, and online travel services went from initial introduction to maturity within a few years. Social networking was launched in 1997 by www.sixdegrees.com. By 2005, a number of sites were rapidly building their networks, including MySpace, Orkut (Google), Badoo, and LinkedIn. However, it was Facebook that broke away from the pack”. Today Facebook is used by more than 1/3 of the planet population.
Source: HBR.
“Patterns of evolution also differ. Industries supplying basic necessities such as residential construction, food processing, and clothing may never enter a decline phase because obsolescence is unlikely for such needs.  Some industries may experience a rejuvenation of their life cycle. In the 1960s, the world motorcycle industry, in decline in the US and Europe, re-entered its growth phase as Japanese manufacturers pioneered the recreational use of motorcycles. The market for TV receivers has experienced multiple revivals: color TVs, computer monitors, flat-screen TVs, and, most recently, HDTVs. These rejuvenations of the product lifecycle are not natural phenomena—they are typically the result of companies resisting the forces of maturity through breakthrough product innovations or developing new markets.
“An industry is likely to be at different stages of its life cycle in different countries. For example, a life-cycle of one industry in the US can be different in one country in Latin America or India or China. For Example: Although the automobile markets of the EU, Japan, and the US have entered their decline phase, those of China, India, and Russia are in their growth phases. Multinational companies can exploit such differences: developing new products and introducing them into the advanced industrial countries, then shifting attention to other growth markets once maturity sets in”.
“A further feature of industry evolution is shifting boundaries of industries—some industries converge (handheld consumer electronic devices such as wireless phones, portable game players, cameras, and calculators increasingly compete in a single market); other industries, such as computers and mortgage banking, tend to fragment”.
I have prepared the following set of slides for today´s topic. I wanted to show you different life-cycle graph industries patterns. Let´s read the slides:
If you wish to download the presentation in PDF Format, click here: Eliescalante Leg 5 Life Cycle d 30jan2018.
This is all for today. Tomorrow we will continue with the next Industry Evolution theme: “Structure, Competition and Success Factors over the Life Cycle”. Thank you so much.
Source References:
http://www.businessinsider.com/apple-iphone-sales-by-year-2016-4
http://www.businessinsider.com/uav-or-commercial-drone-market-forecast-2015-2
http://www.goldmansachs.com/our-thinking/technology-driving-innovation/drones/
https://beintheknow.co/sustainable-growth/
https://thomasdorsey.wordpress.com/2015/09/29/apple-products-and-their-s-curves-a-comparative-study/
http://www.billsynnotandassociates.com.au/kb/163-life-cycle-approach.html
https://www.census.gov/eos/www/naics/
Disclaimer: The content and presentation slides shown on this blog are prepared by me. Nevertheless, all the pictures or videos shown on this blog are not mine. I do not own any of the lovely photos posted unless otherwise stated.
