
Cacao and Coffee 101. Success Strategies for Small Farm Holders. Episode 6. Customer Segments
Dear readers:
We have been so busy reviewing the databases of the coffee and cacao trade products. I have reviewed two main databases: the United Nations Comtrade Database and the World Bank WITS (World Integrated Trade Solutions) for exports and imports of our two beloved harvests. Our goal was to understand the big picture first (from the general to the particular). Although most of the numbers were available, we traced and extrapolated some that weren´t. For us, reviewing the numbers is a delicate process. We can´t create good strategic reflections if we do not take the time to review the data. Without good data, we are unable to understand the real problem of the upstream producers, and we are required to prioritize which segments of products are indeed more important than others in the global marketplace. During the weekend, we have already added the rest of the graphs from the side of the trade imports and exports. We will add the horizontal coffee import analysis (from 2020 to 2024) per top countries of trade, and other interesting data-charts that we have uncovered.
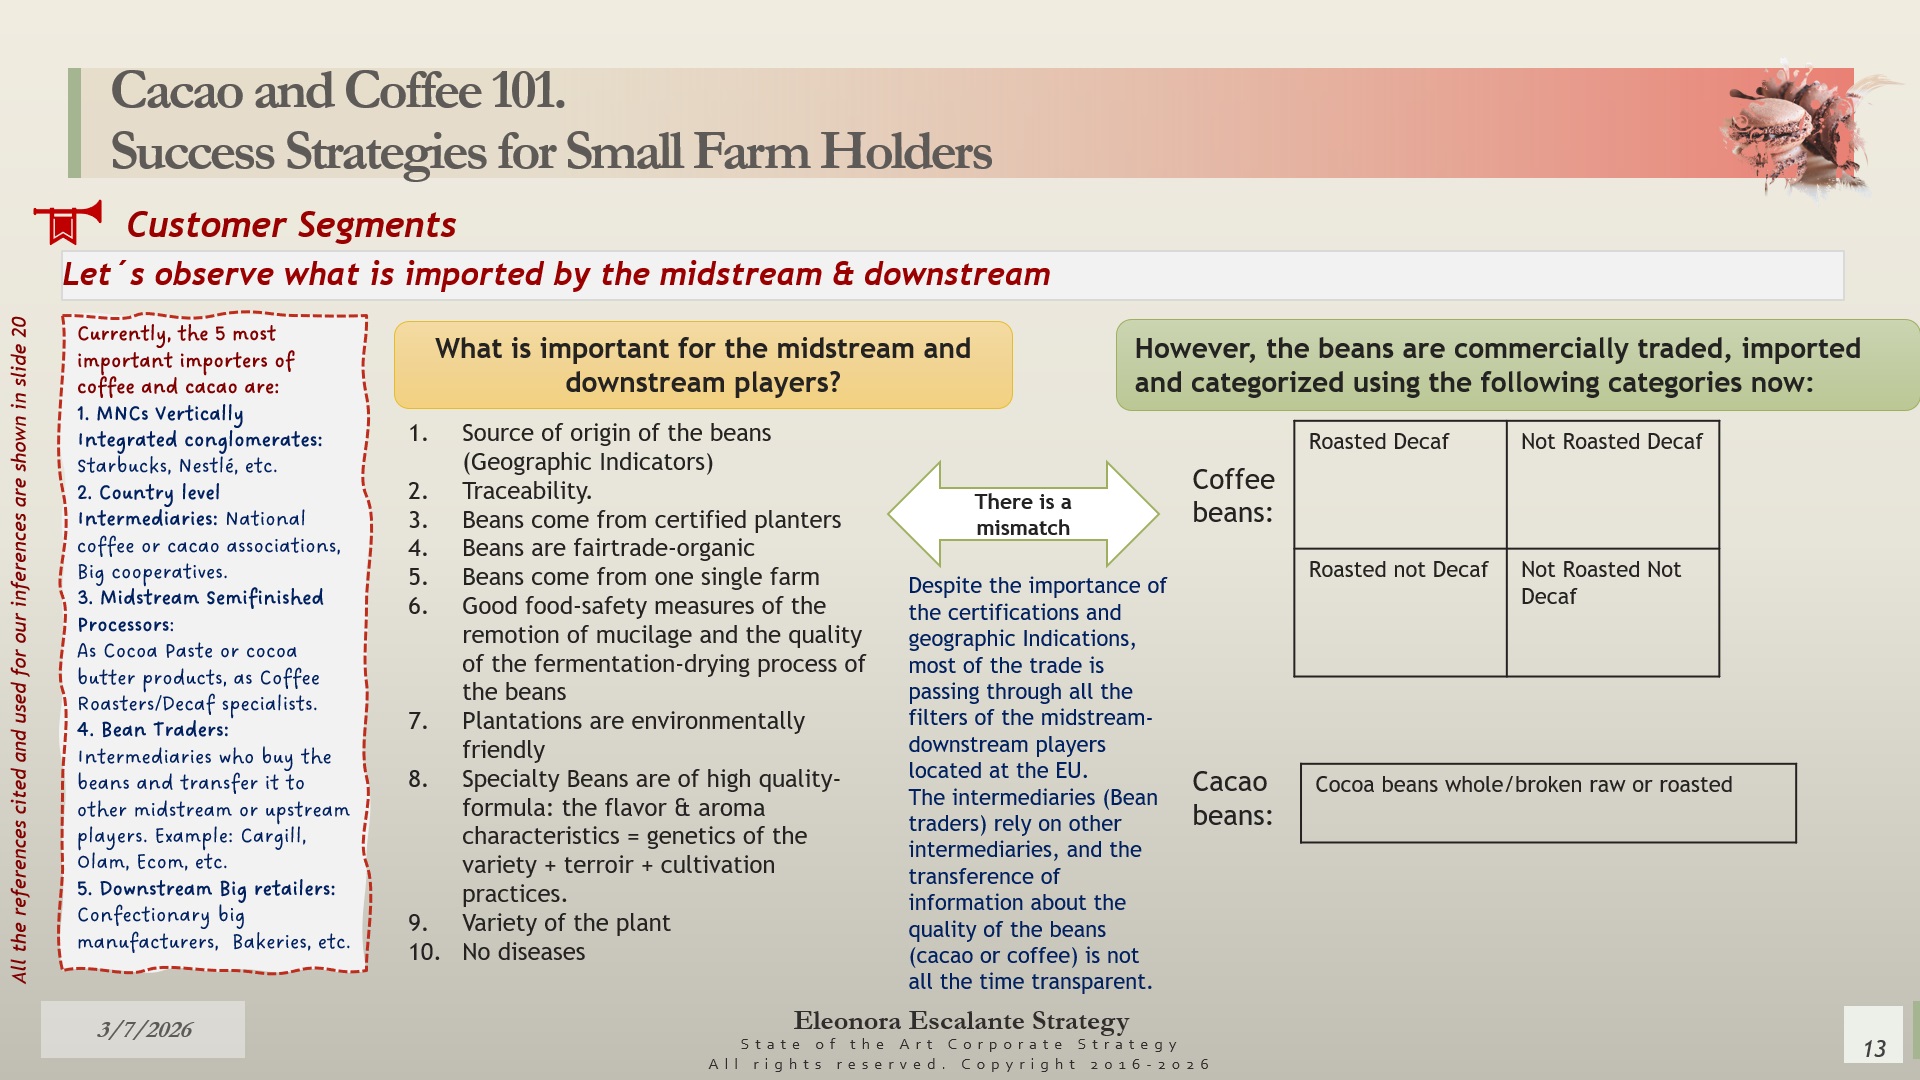
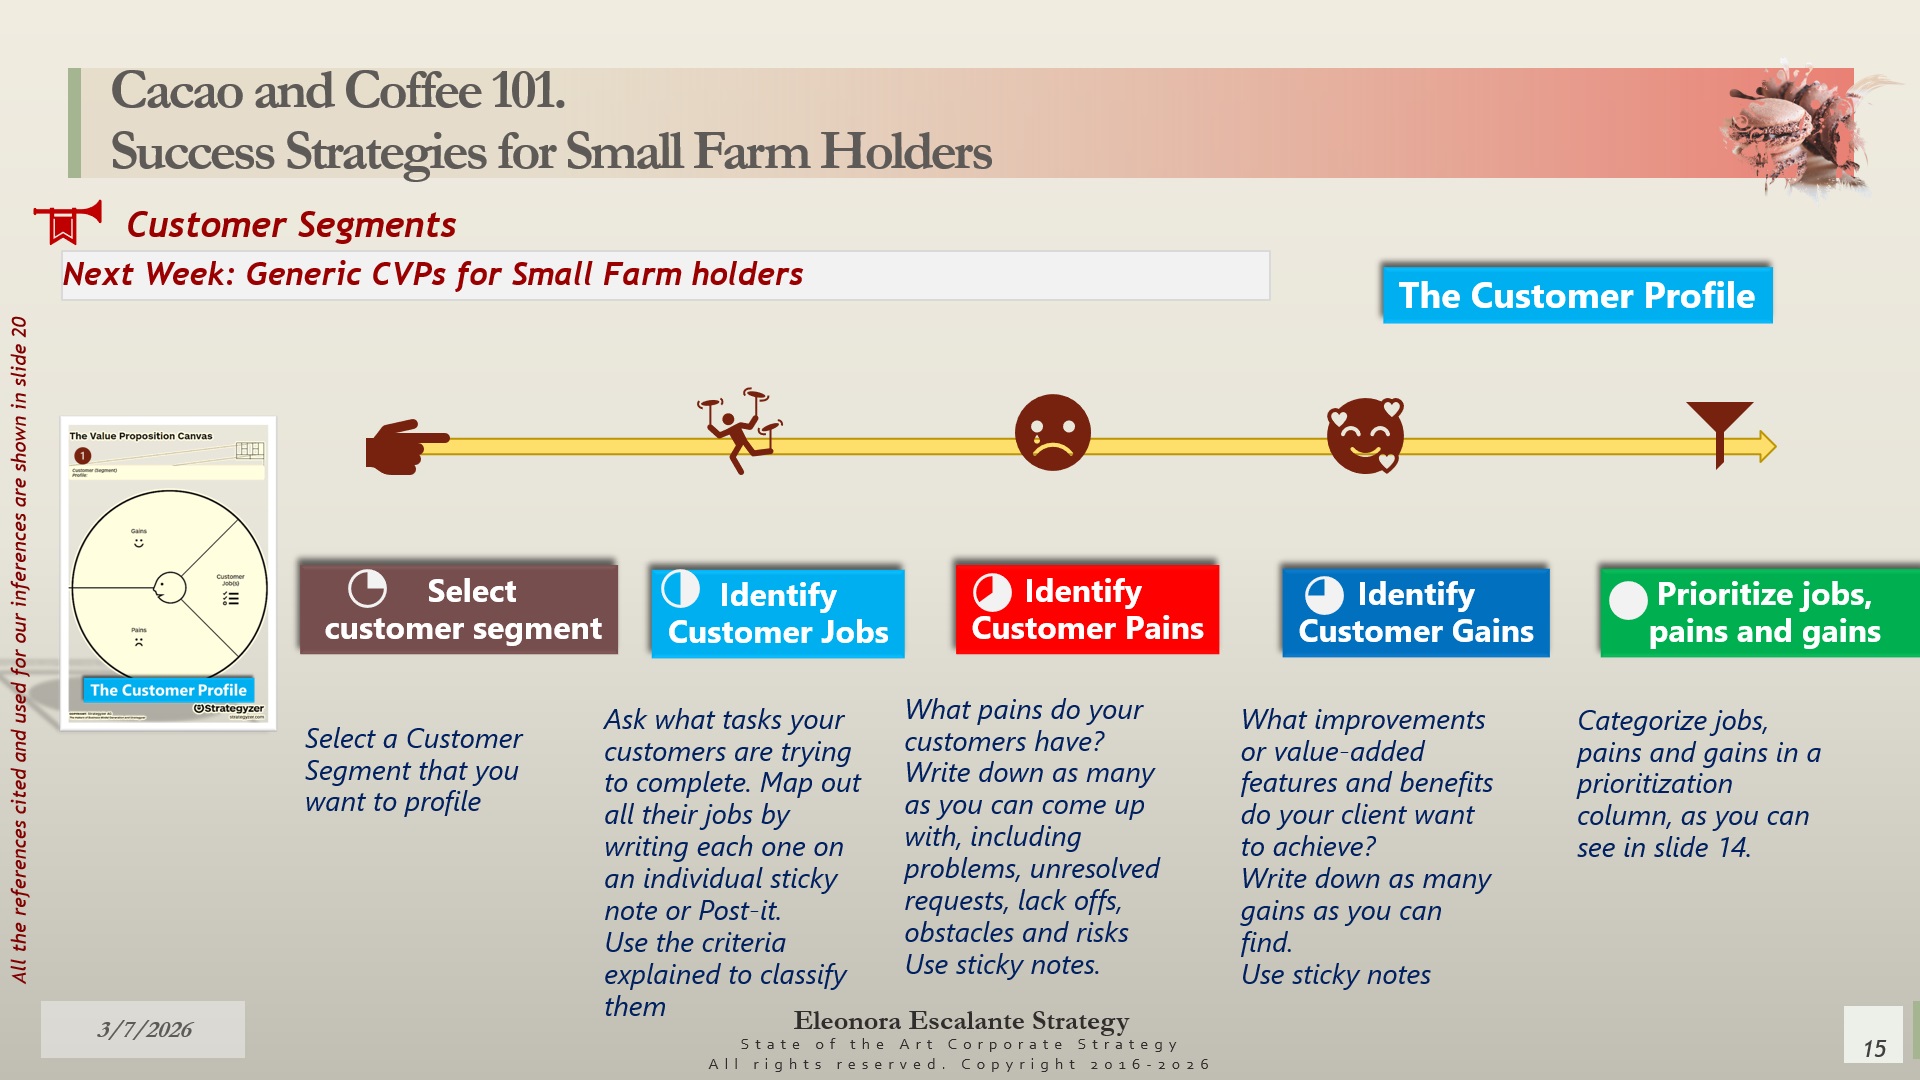
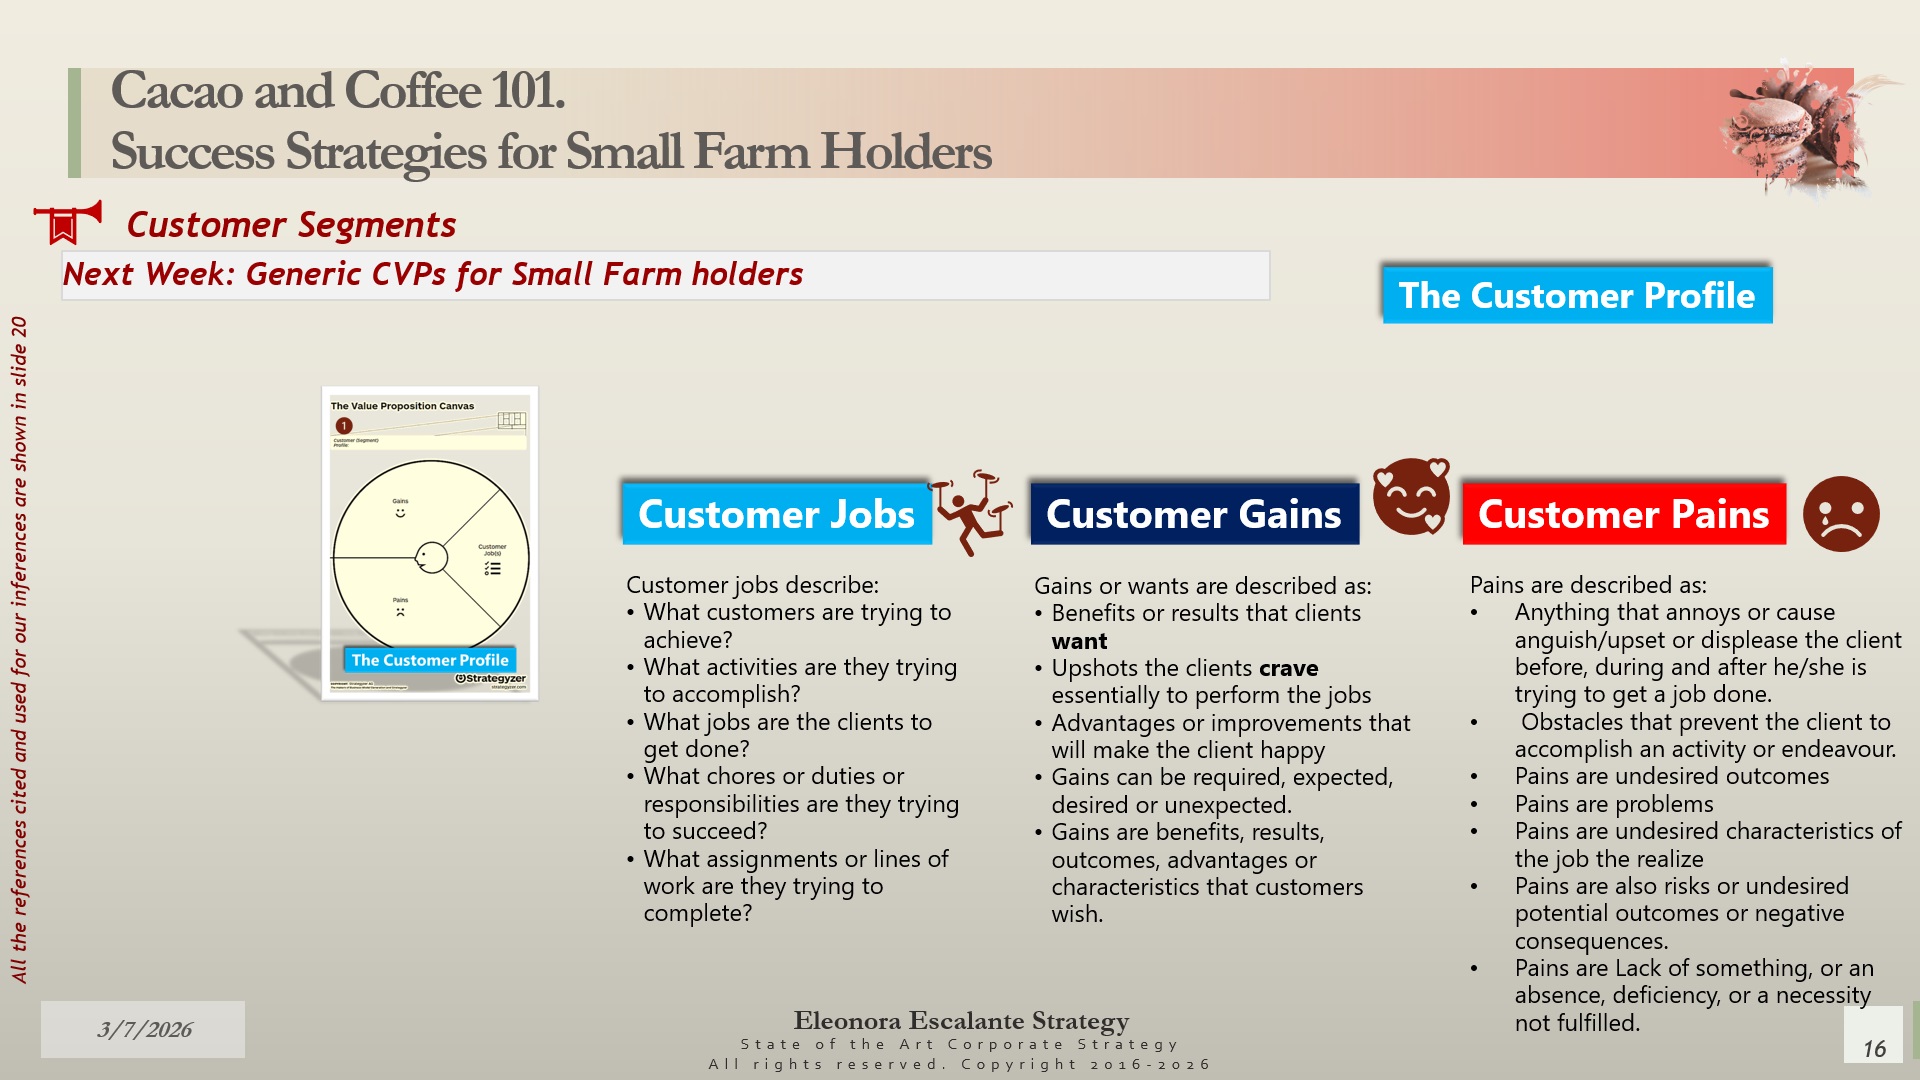
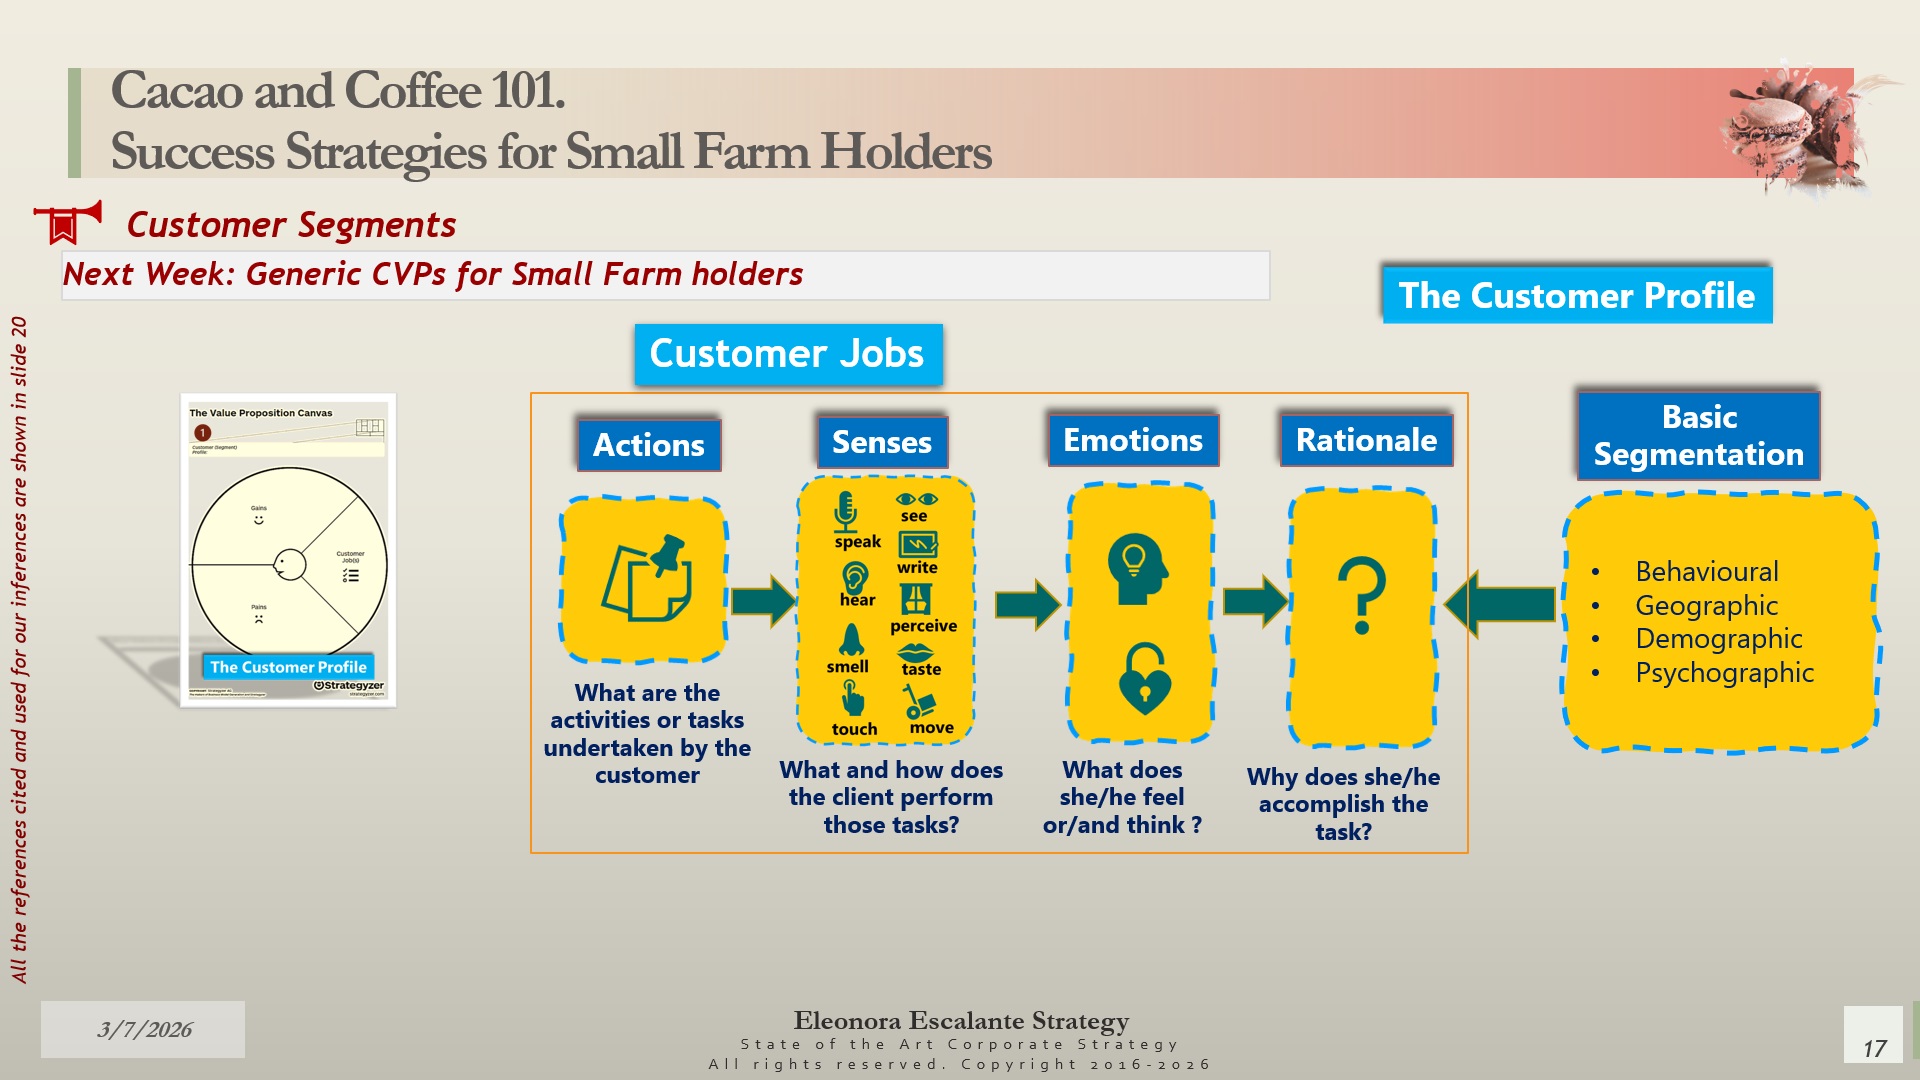
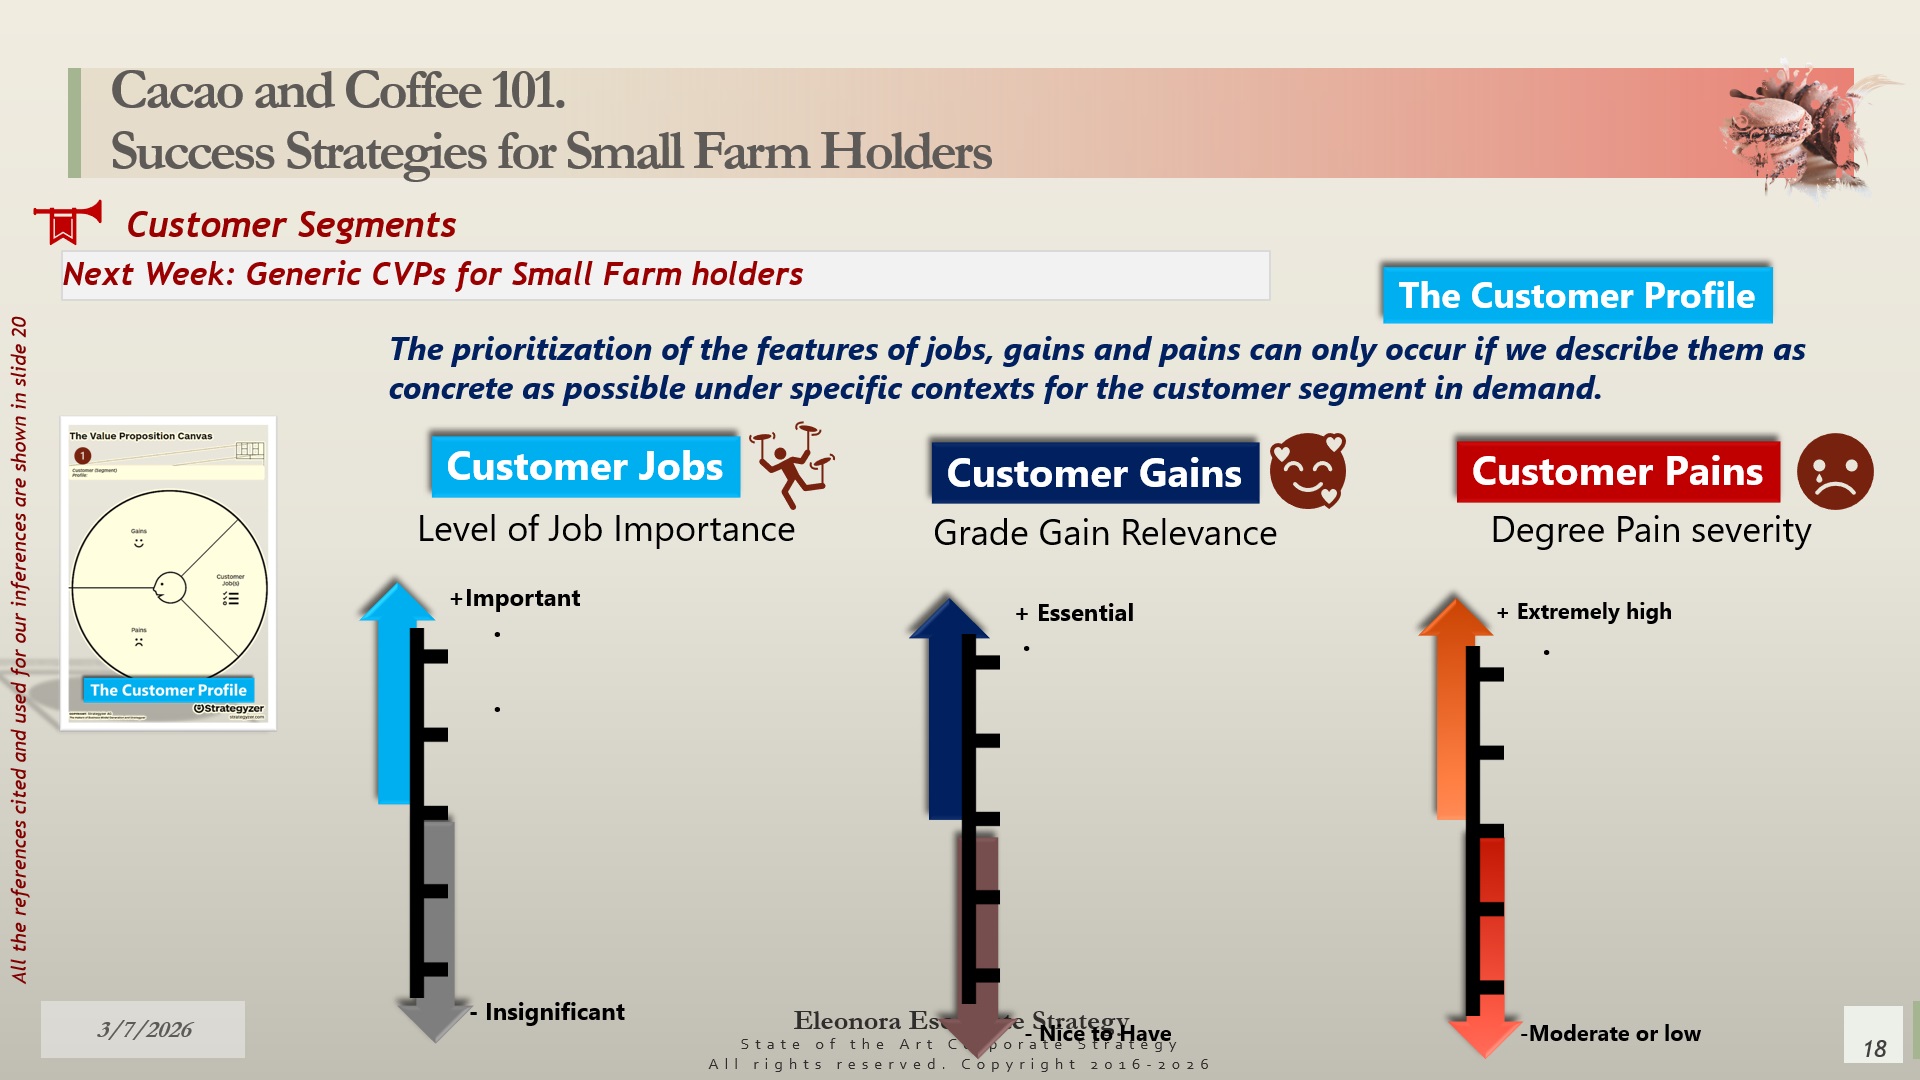
For the time being, you will discover the proposals of three customer segments that the small farmers will face in the future, once the Appellation d´Origine Contrôlée (AOC-French name), or the Protected Designation of Origin (PDO in terms of the European Union), is embraced by the farmers. Next week, we will build the customer value proposition for these three customer segments, and the week after, we will continue with each value map. Slides 8 to 12 are the theoretical background that we will use for the next episode. We encourage you to review the following 3 academic episodes in which we explained everything about customer value propositions, value maps, and the fit between both by clicking below:

We kindly ask that you return next Monday, the 6th of July 2026, to review our strategic reflections on this chapter.
We encourage our readers to familiarize themselves with our Friday master class by reviewing the slides over the weekend. We expect you to create ideas that are or are not strategic reflections. Every Monday, we upload our strategic inferences below. These will be discussed in the next paragraph. Only then will you be able to compare your own reflections with our introspection. We always give our students a couple of days to prepare well before our final reflection.
Strategic reflections on this episode.
These will be in the section below on Monday, the 6th of July of 2026.

Cacao and Coffee 101. Success Strategies for Small Farm Holders. Episode 6. Customer Segments.
We can´t project for the future if we do not distinguish the truth from the past, and we do not recognize how the present is carried on.
Our strategy house is strictly committed to performing our daily activities using the methodologies and intellectual savoir-faire of the 1990s-2000s. On purpose, we avoid using Generative AI applications, and without hesitation, we are so bold and severe about this, not just because we are on the correct path about protecting our analytical brainpower, but because we also perceive that going against the pro-AI current direction, chosen by the top consulting houses of the world, is adding more value to our role. By not following them, we are transforming ourselves into a distinguished, unique strategic house dwelling in the hub of the tropical belt nations. And our uniqueness is more relevant and pertinent than ever before. Of course, our decision to go against the flock is challenging and criticized. It requires us to do our analysis at a slower pace, and it requires more time. But this is what will distinguish us in a few years from now as a unique top cerebral consulting corporate strategy house which will be demanded to rescue the rest from the mess of the future: The forthcoming order of AI dyscognitive handicapped professionals who are now relying on AI algorithms instead of themselves. We will maintain our anti-AI position, no matter what. For us, it is more valuable to do our job well than to rush into efficiency and productivity with wrong data, incorrect AI assumptions, or invalid reasoning. Additionally, whenever we make a mistake (which happens), we know it is related to third-party databases, not to our role as advisors. In consequence, we proceed to modify the data if we perceive it is incomplete or unfinished.
Given the latter explanation, we took a few days last week to understand the dichotomy between imports, exports, and re-exports of cacao and coffee. We started with the general overview of the data per country. Then, we implemented a specific roadmap for certain countries, from the upstream farmers to the downstream retailers, using separate entities in each of the steps of the route or considering total vertical integration. We have already comprehended the big picture, even with the mistakes of the databases used (which are incomplete for the year 2024-Exports), and we expect you to understand it too. It took us immense attention to detail to land on feasible, appropriate numbers. We couldn´t rely on figurative data or interpretations of data from others who are using AI to obtain the results. But still, we believe the margin for error is around 7.5%. The slides have been revised several times over the weekend, because we amended the missing numbers by allotment from each of the categories of products. Still, after all our efforts, the United Nations data (WITS database and UN Comtrade), which is the foundation of our analysis, is not sufficient to provide an entire assessment. Why? Dry beans (coffee or cacao) are subject to inventory at the upstream, midstream, and downstream portions of the global value chain. In consequence, not all the produced harvest from one year is dispatched to the importing nations; it is well possible for traders and warehouse-brokers to keep the beans for some weeks or months, and that quantity is not apportioned to the year of analysis, but to the next year. Additionally, once the beans are processed into paste or liquor, as in the case of cacao, with the studied databases, we have no idea about the raw material year of what timing harvest. Finally, the price per kg is changing all the time. Although the midstream players pay a CIF price, because of the constant variability of supply vs. demand, the pricing for the resale of the beans and further manufactured categories is capriciously fluctuating. Though with all the previous limitations, we believe this analysis may help the small farmers to see an ample panorama of their potential clients in the future, other than the usual domestic intermediaries, if they decide to upgrade the value of the beans using an Appellation d´Origine Contrôlée or Protected Designation of Origin (PDO) system. This is the essential contribution of this class.
Coffee Global Imports. Slides 4 to 6.
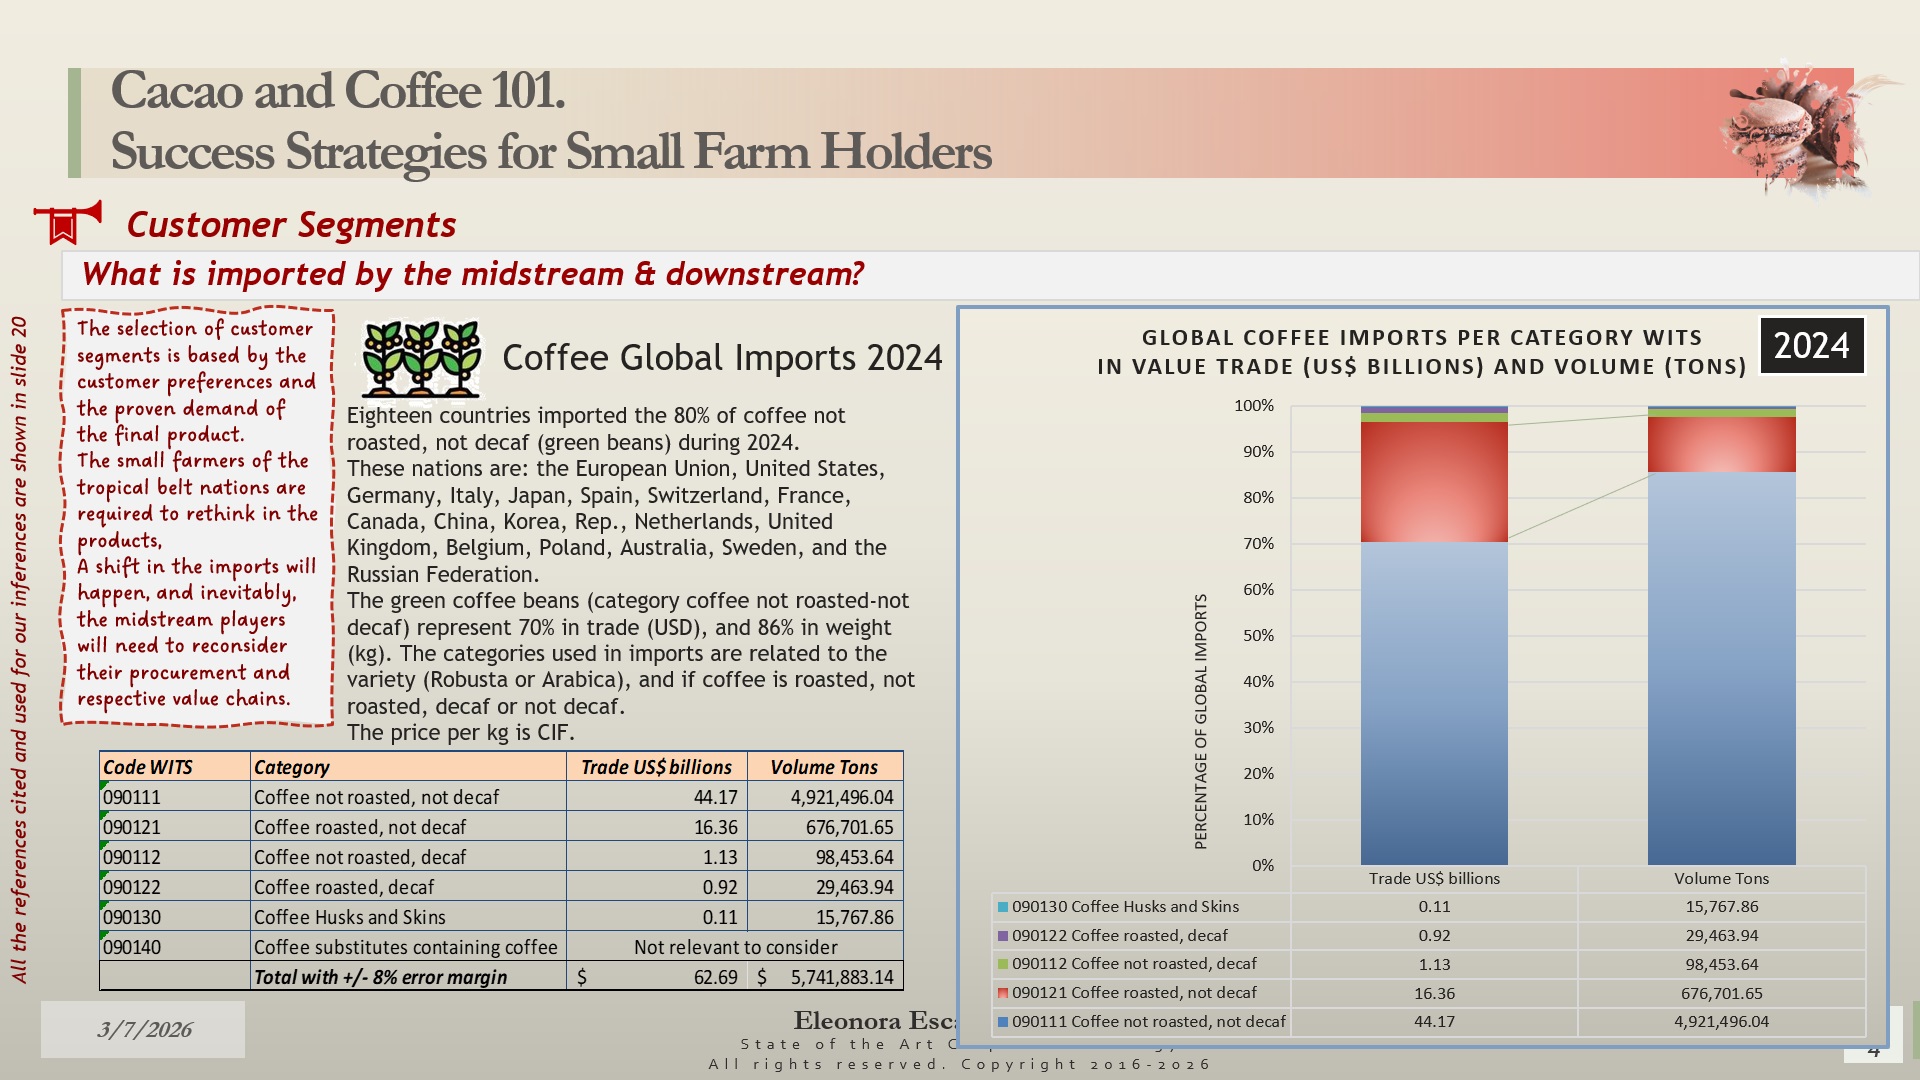
Let´s see the perspective of the demand for coffee. The total volume of coffee imported during the year 2024 ascended to 11.5 billion kg of coffee, which is the equivalent of 5.75 million metric tons or 191.4 million bags of 60 kg. Our calculations are based on the informed data of the UN-World Bank trade databases. In comparison, the International Coffee Organization (ICO) has reported the world coffee production for the 2024/25 coffee year at 177.5 million bags of 60 kg, up 5.2% compared to the coffee year 2023/24 (1). The ICO also has stated production of 102.1 million bags of Arabica variety and 75.4 million bags of Robusta. The difference between our calculations based on the United Nations Comtrade and World Bank WITS trade databases is straightforward: the imports are above the production levels, because in terms of trade, there could have been a remainder of inventories from previous years, and not all the nations producing beans are members of the ICO reporting their data. Still, the margin of difference is 7.8%, which is within a good range of tolerance for our research.
The total size of imports (at a CIF US$ value) is 62.69 billion USD. The international pricing (I-ICP) during the coffee year 2024/25 ranged between 250.5 and 354.4 US cents/lb., a price that was higher after a decade. And, good news, the Colombian Milds and Brazilian Naturals saw an increase in their price to an average of 350 US cents/lb. The total global coffee imports size is approximately the equivalent to the nominal GDP or Jordania, Cameroon, Tunisia, or the total amount of remittances that Mexicans sent to their families living in México from the USA last year.
The two main categories of trade in terms of global coffee imports are the green beans, under the category of Coffee not roasted, not decaffeinated (70.5%), and the coffee roasted, not decaffeinated (26.1%). Both categories represent the sum of 96.6% of global imports in economic value (year 2024). Additionally, in terms of weight (kilograms or tons), both products denote 86% and 12%, respectively. From this analysis, we can conclude that the core business of this economic sector is the trade of green beans. See slide 4.
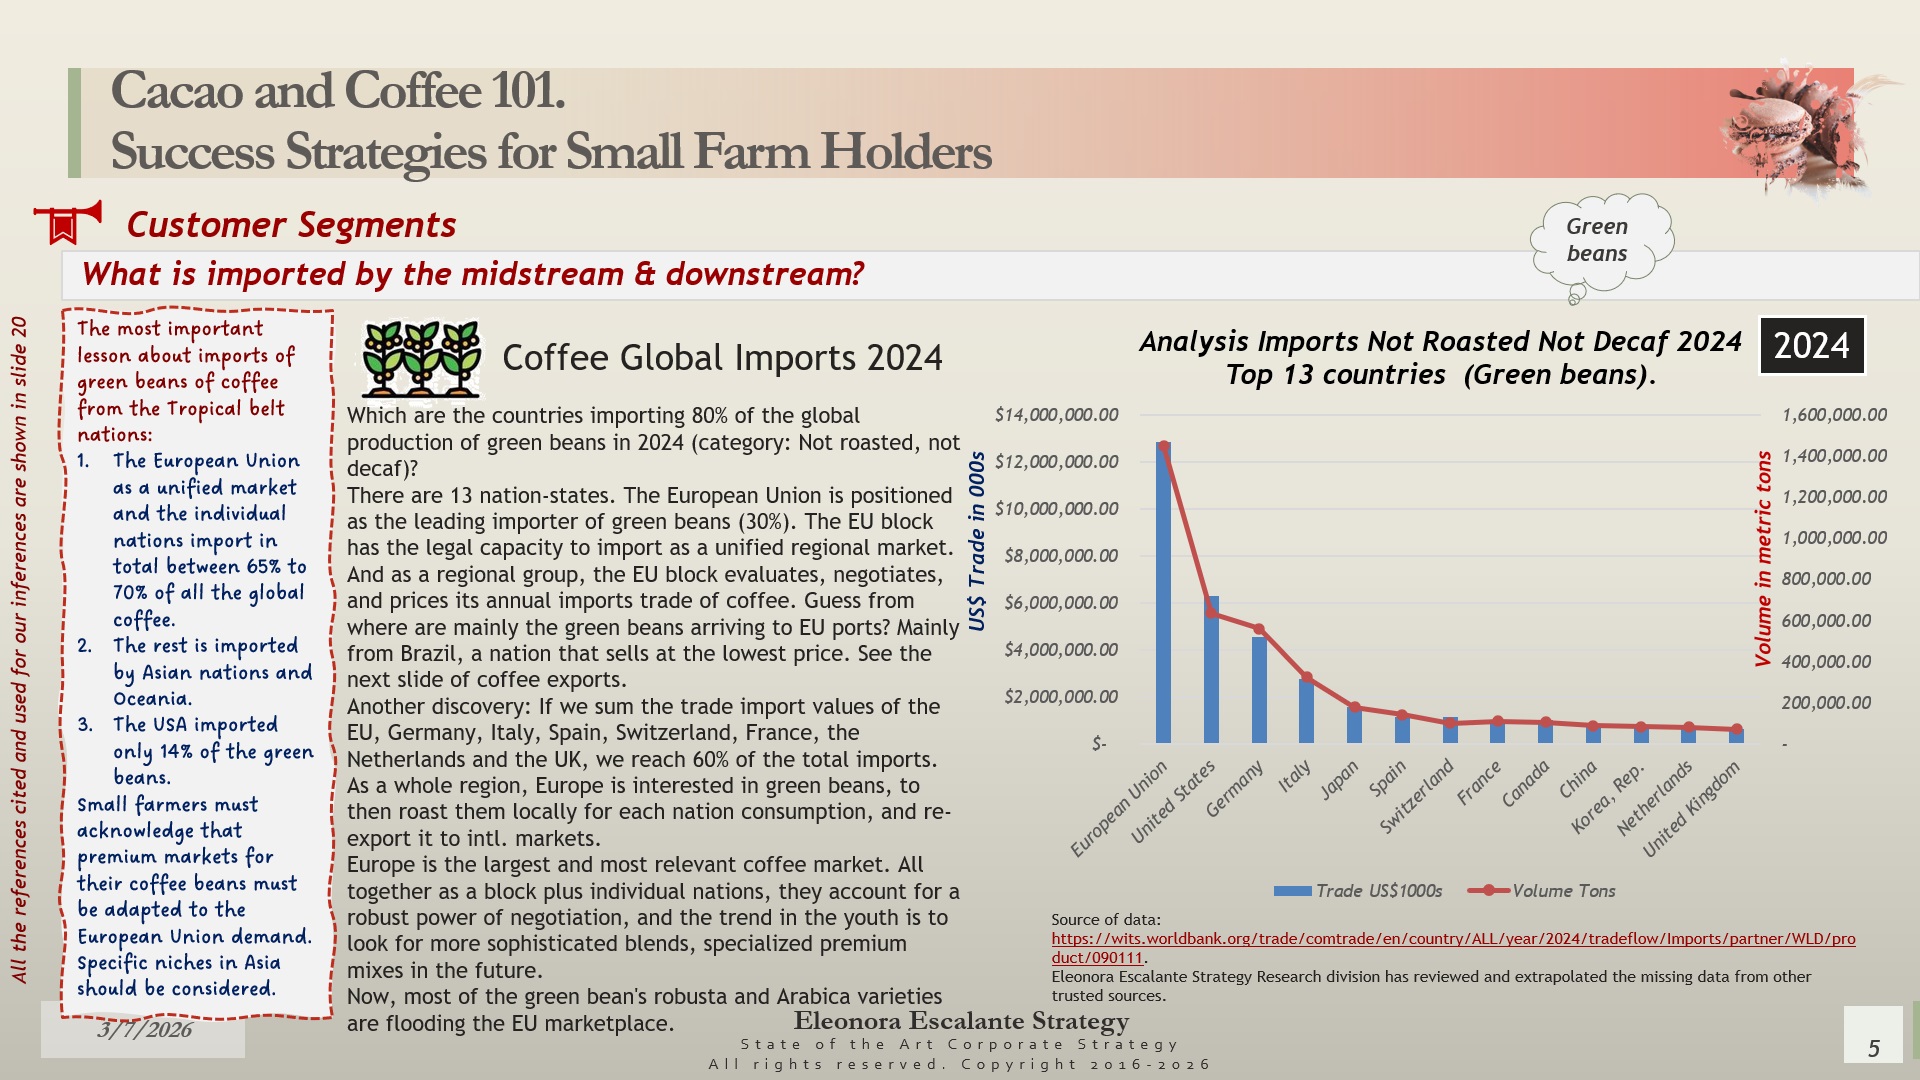
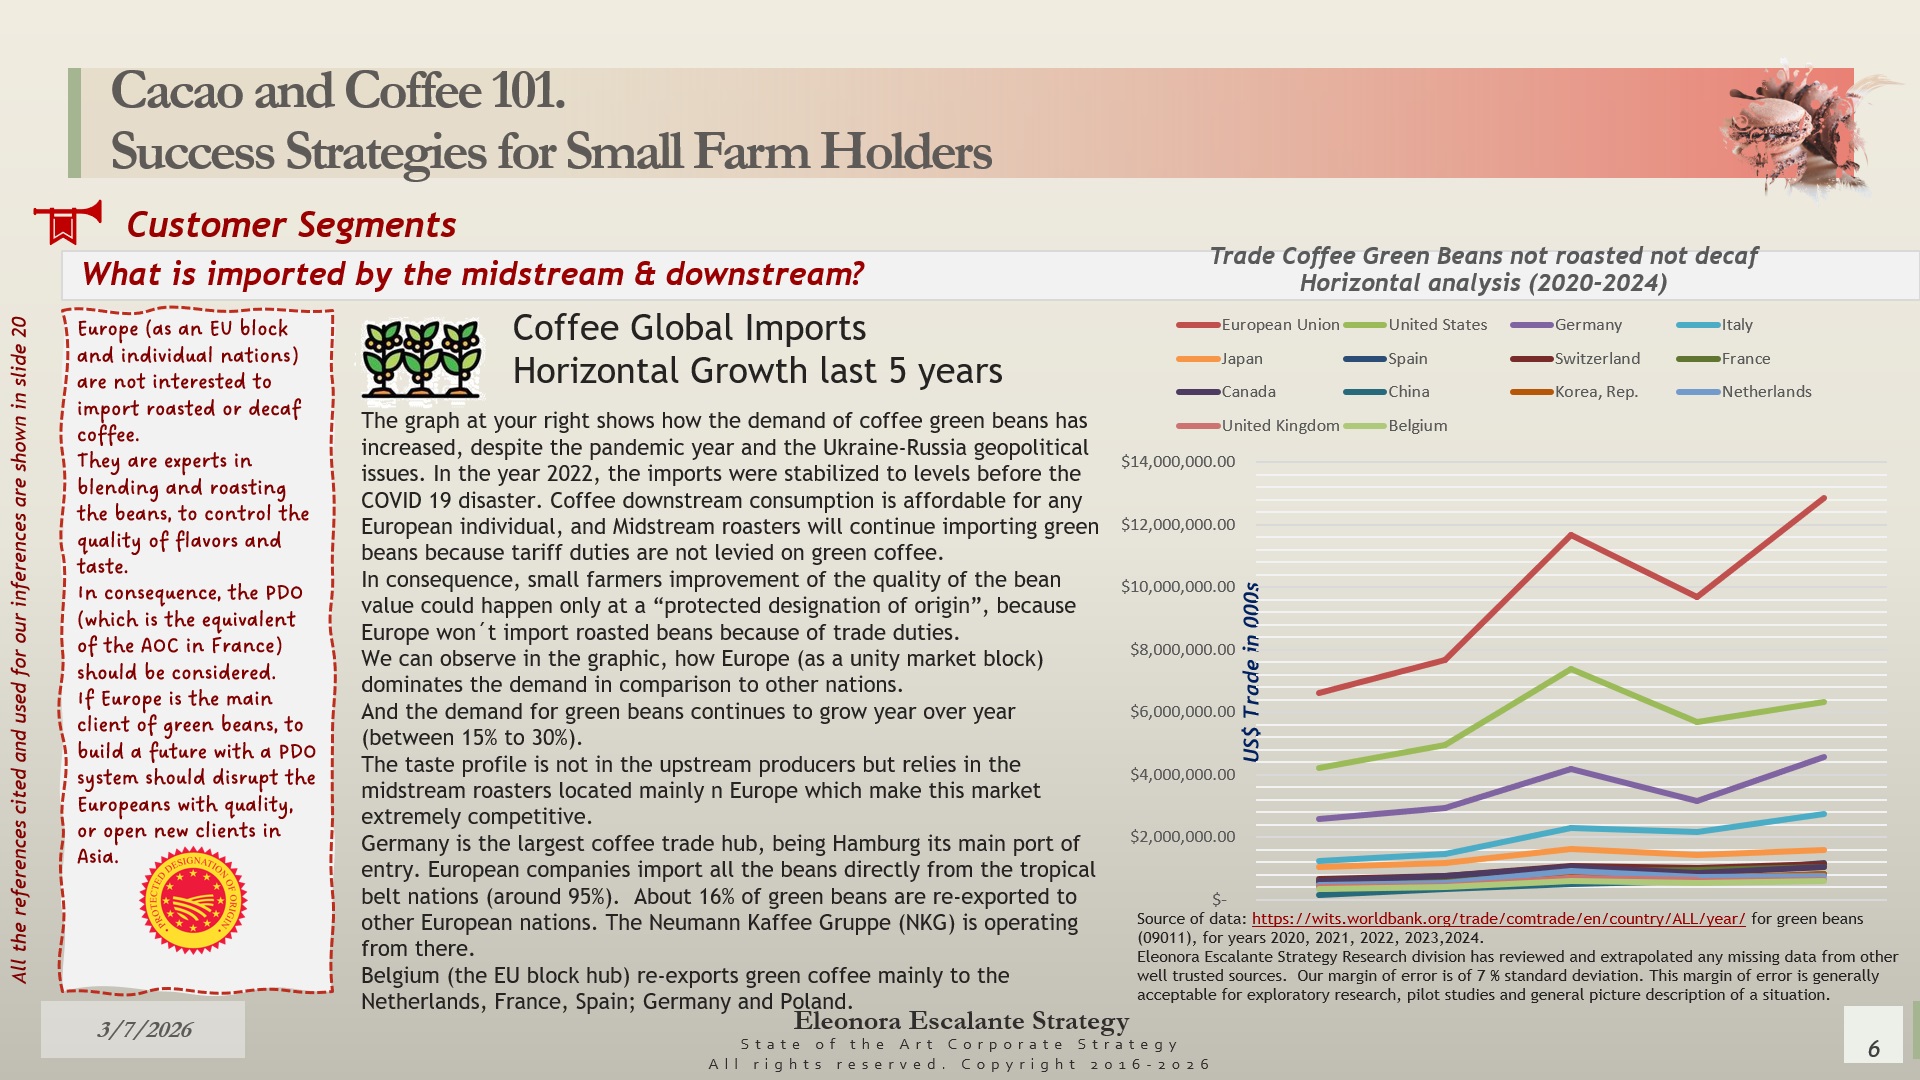
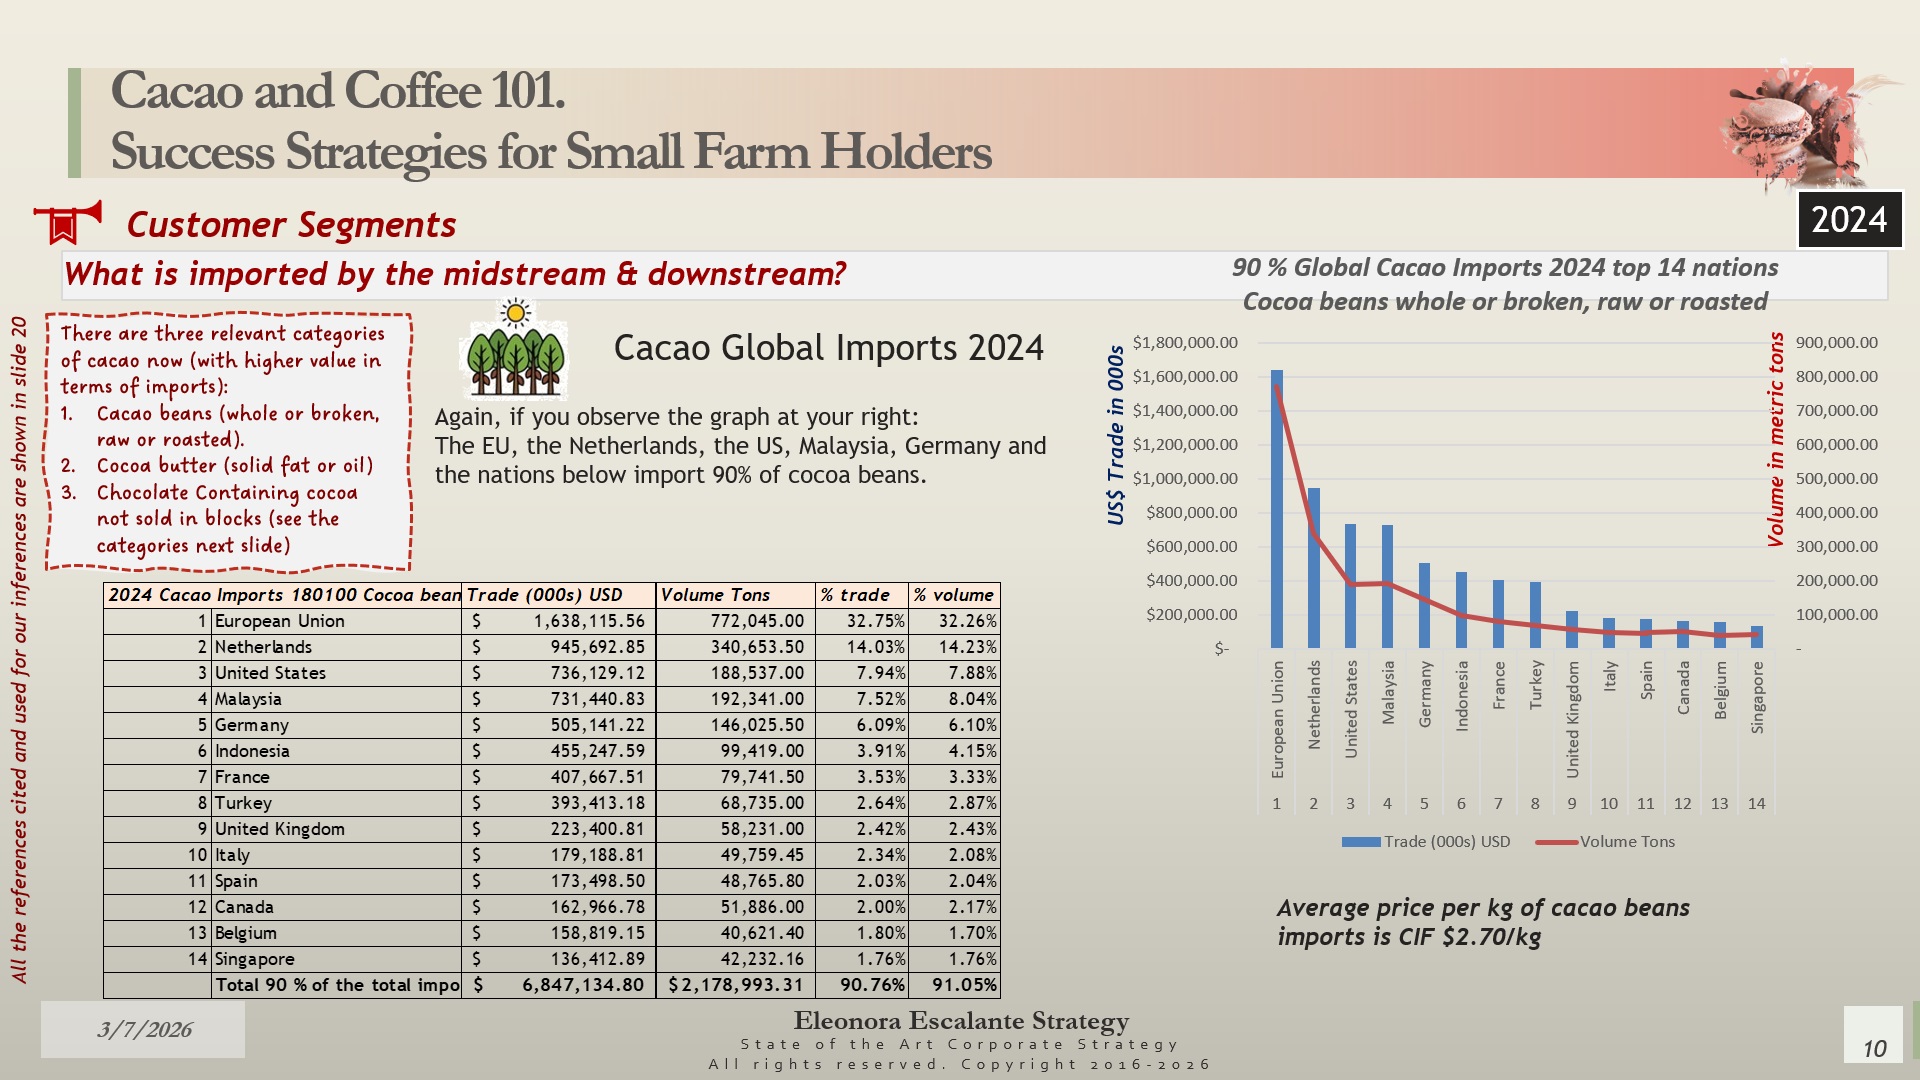
There are 23 nations out of 139 importing 90% of the green beans. However, it is the European Union as a unit market block and the nations of Germany, Italy, Spain, and Switzerland that are driving the pricing, quality, and demand preferences from Europe. The USA imports around 14% of the total. See slide 5. New Asian importers, such as China and Korea, have shown a steady demand increase, and both nations are now in the top 20 importers of beans. Read slide 6.
Coffee Global Exports. Slides 7 and 8.
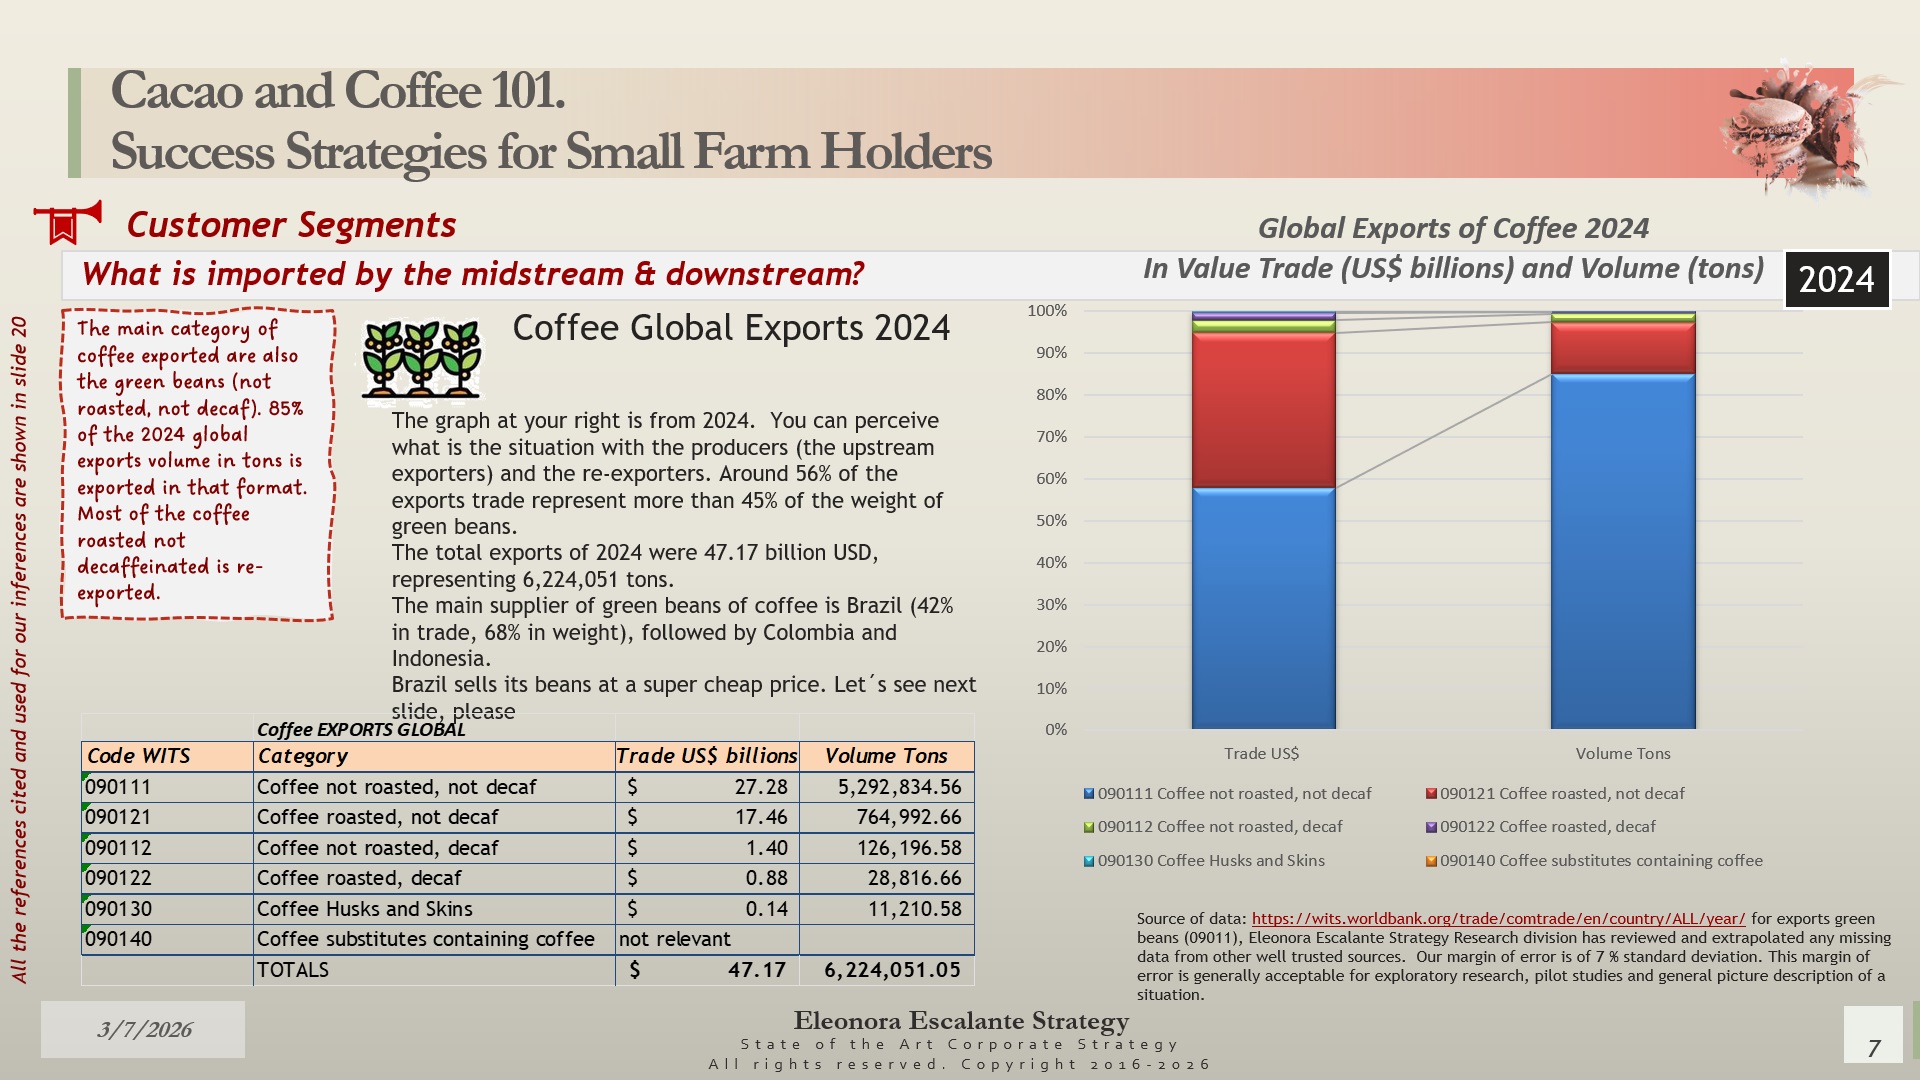
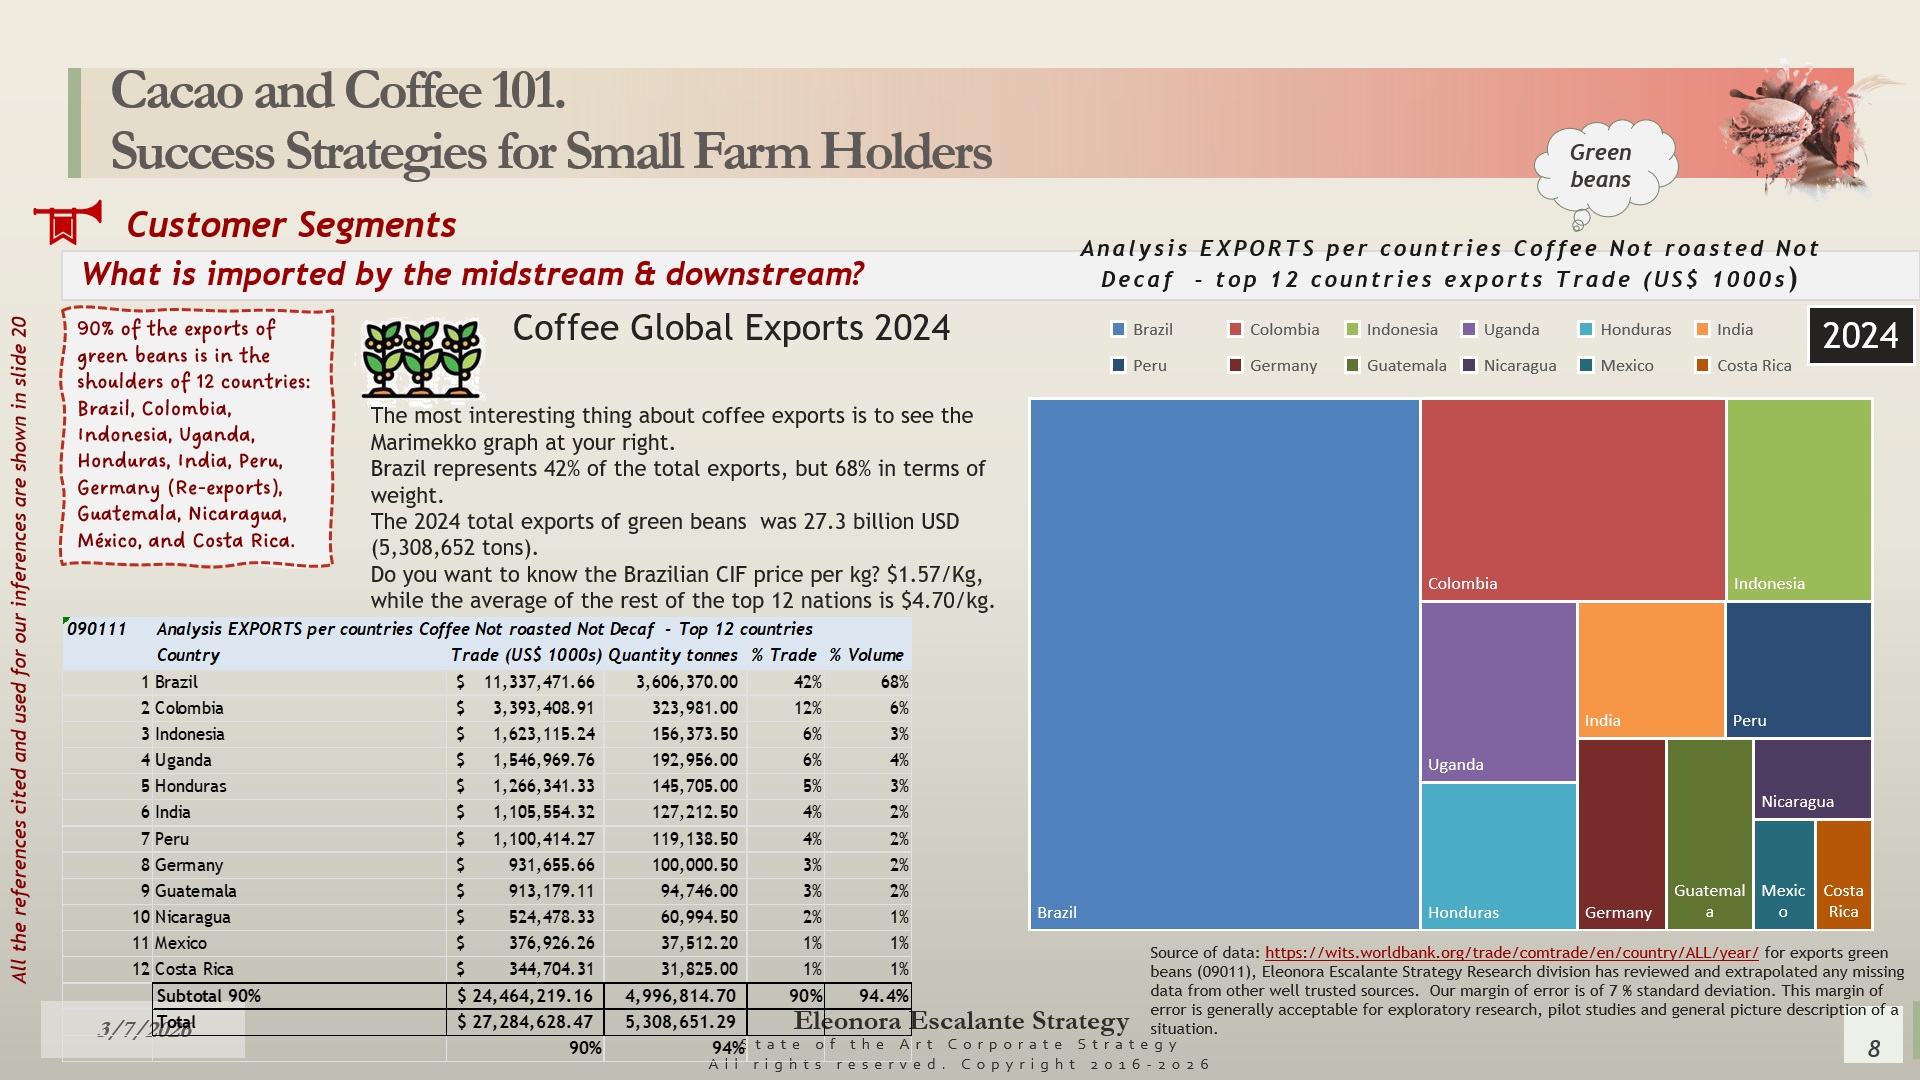
Let´s see the perspective of the supply of coffee. The global exports of coffee soared to US$ 47.17 billion dollars. The difference between the value of total imports and total exports lies in the differential price and the lower value of the beans exported out of Brazil to Europe. The CIF average value of the Brazilian price per green beans/kilogram (2024) was $1.57/kg. However, the CIF average value of what the EU reports on the green bean imports was $4.43/kg. Can you see the differential?
Brazil sells its green beans at a super low price, followed by Vietnam, Colombia, Ethiopia, and Indonesia. Slide 8 shows us which nations are involved in exporting 90% of the green beans: 12 countries, of which Brazil represents 42% in terms of economic trade value and 68% in terms of weight. However, our strategy house has acknowledged that the UN Comtrade and WITS World Bank databases from 2024 don´t include Ethiopia and Vietnam, two of the top exporters of green beans. During this working week, we will modify our analysis and switch the data exports and graphs to the year 2023 accordingly.
Both slides 7 and 8 are self-explanatory.
Cacao Global Imports. Slides 9-11.
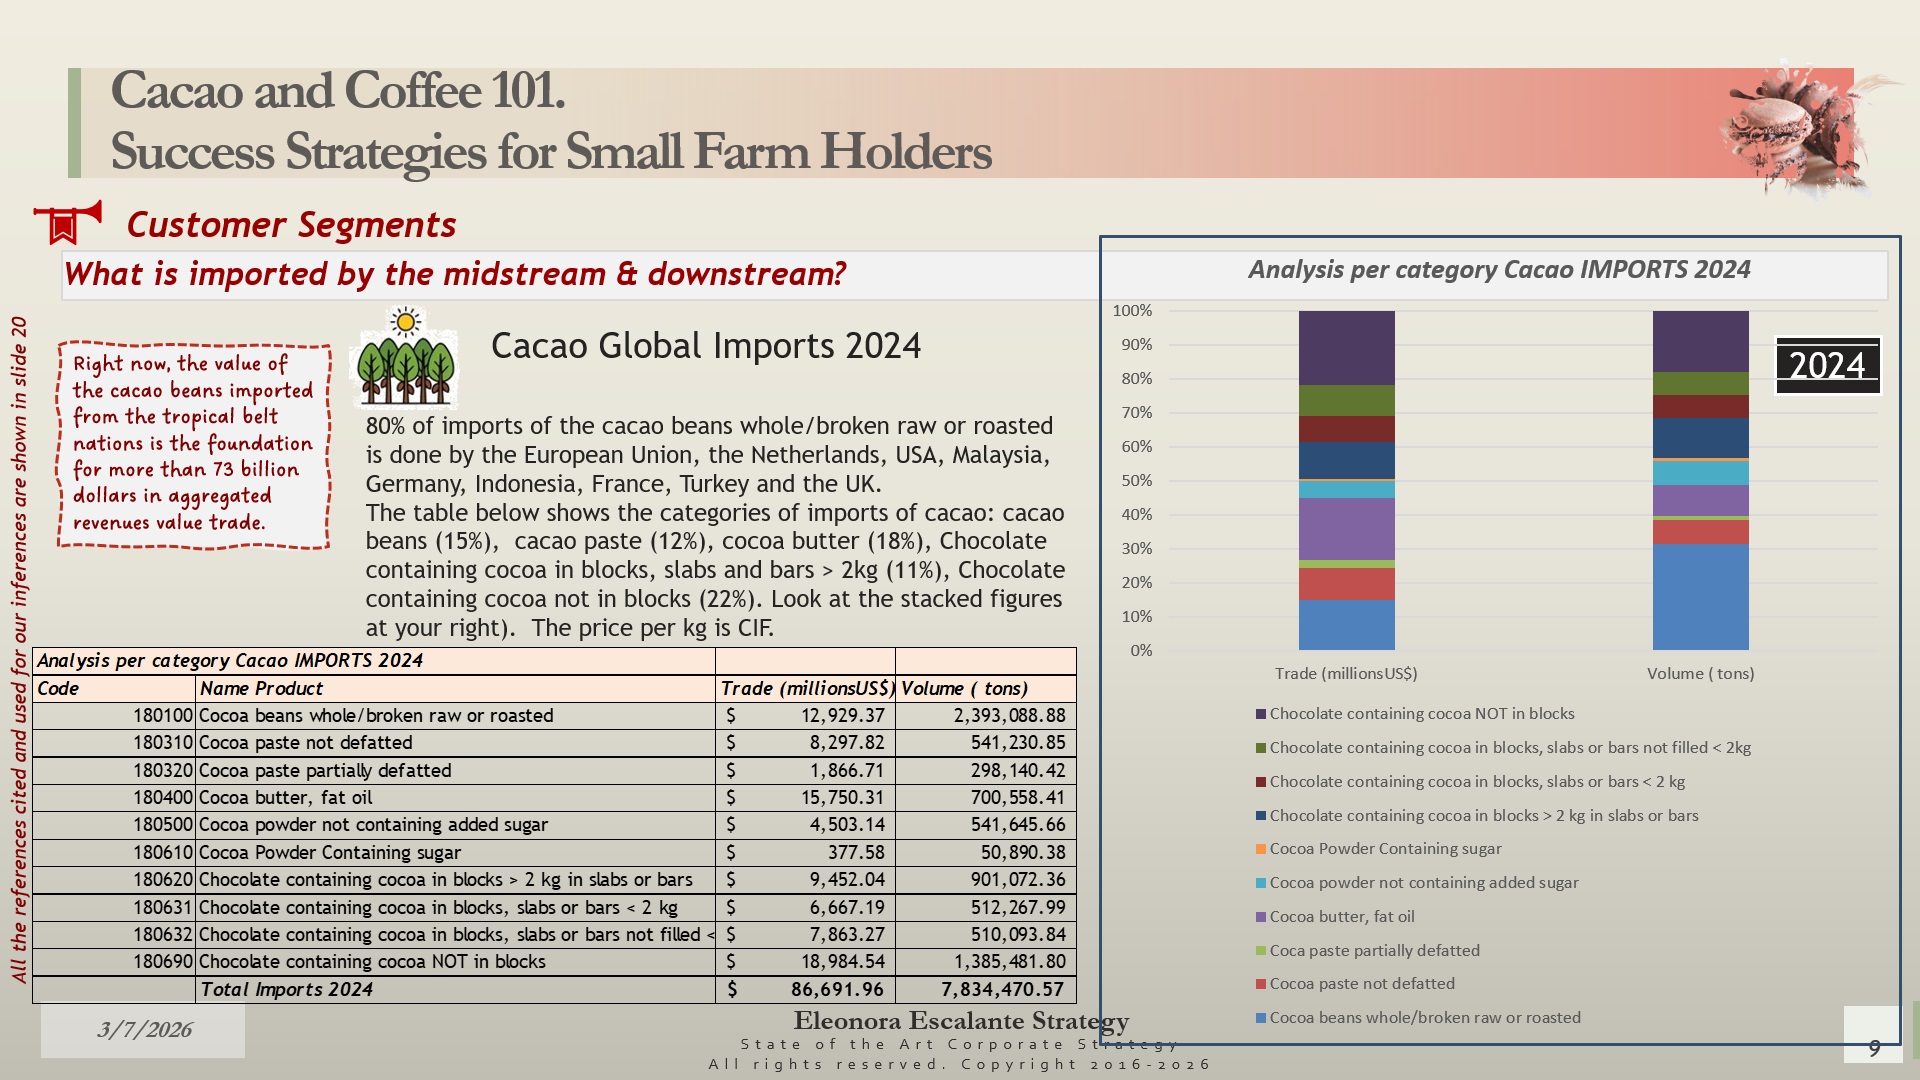
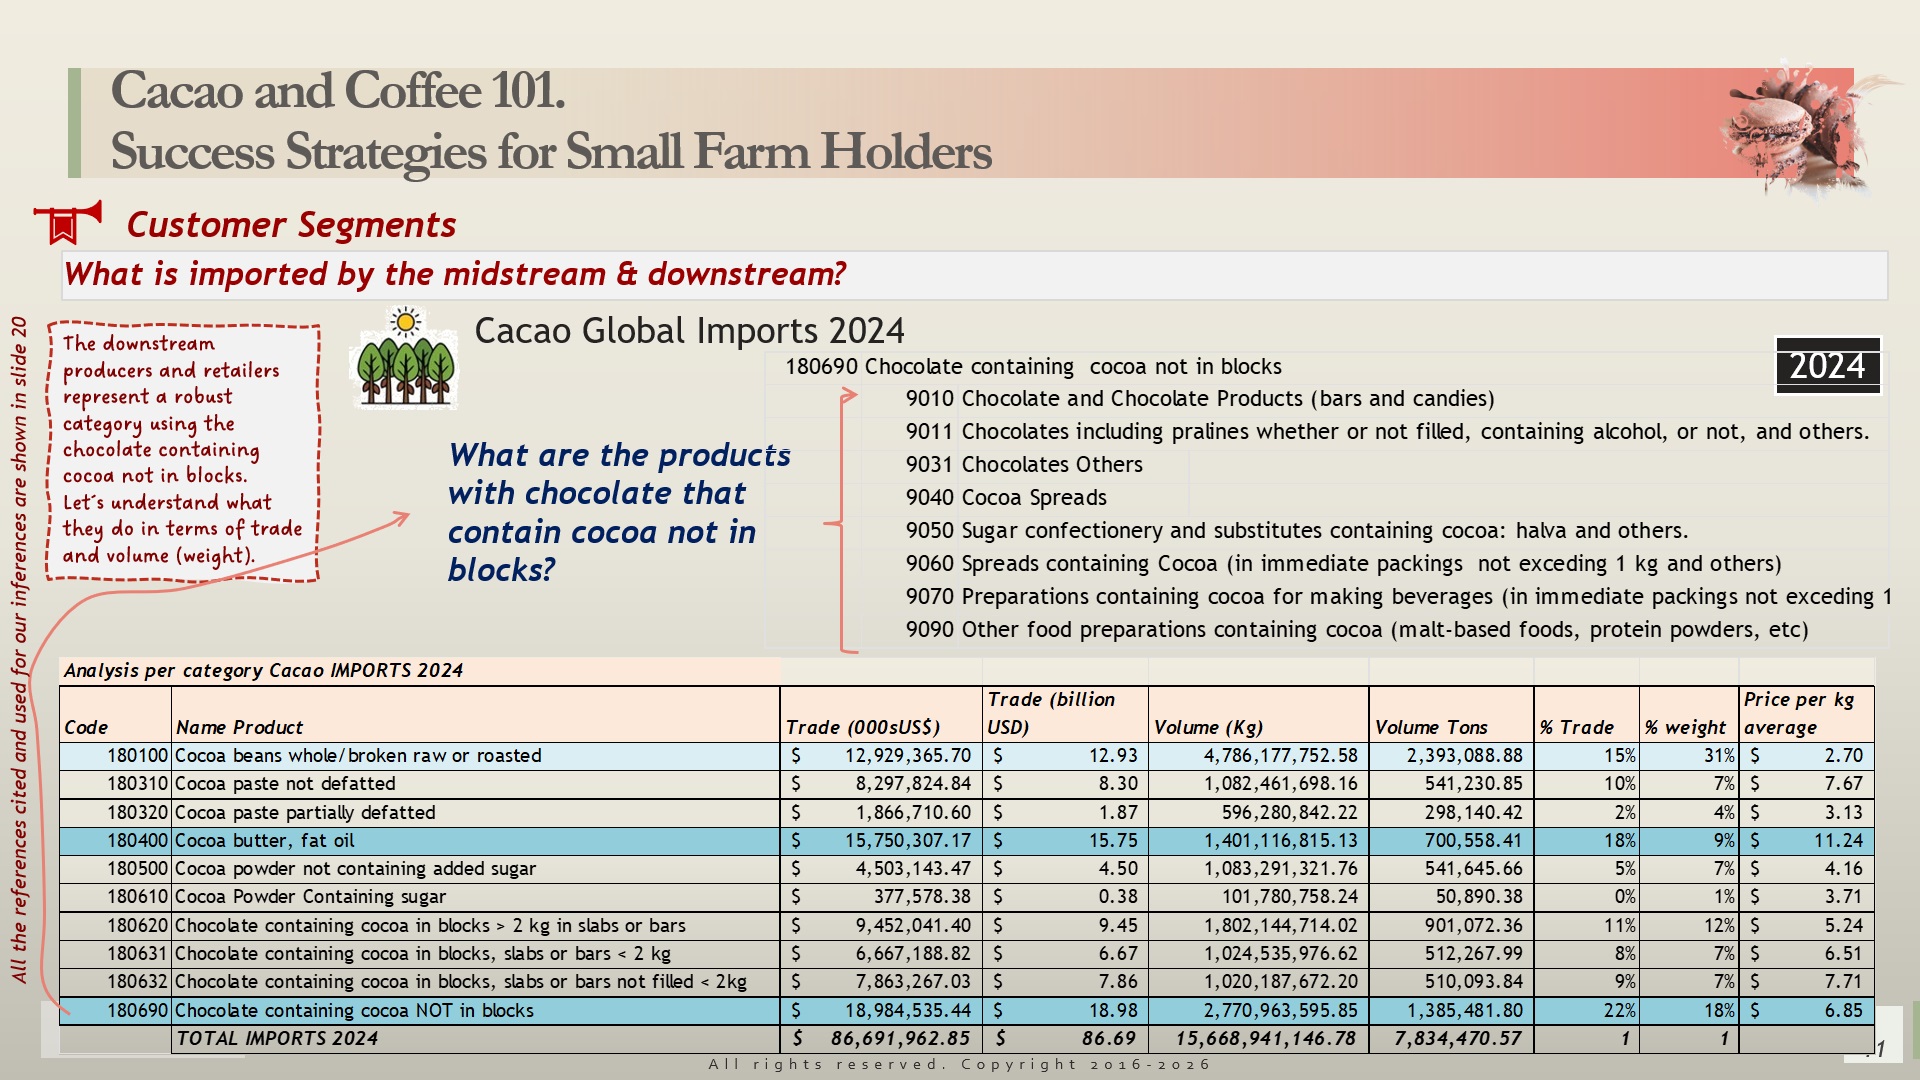
We have inferred that in the case of cacao imports, the diversification of products is more abundant than that of coffee. The beans are sent mainly from the tropical nations to the European Union, the Netherlands, the USA, Malaysia, Indonesia, France, Turkey, and the UK. And the processors of the cacao beans have diversified the categories in semi-finished products such as cocoa paste, cocoa butter, cocoa powder, chocolates in blocks, slabs, or bars with different weights. An analysis of the 10 categories is shown on slide 9. However, the top three in size are the cocoa beans (15% in economic value of trade, 31% in terms of weight), the cocoa butter (18% in economic value of trade, 9% in terms of weight), and the third category are the chocolate products containing cocoa not in blocks (22% in economic value, 18% in terms of weight). This last category is ample, and it goes from chocolate pralines, chocolate sweets, cocoa spreads, preparations for beverages, etc. See slide 11. Finally, the imports of cacao beans per country of demand are shown in slide 10. The graph is easy to follow.
Cacao Global Exports. Slide 12.
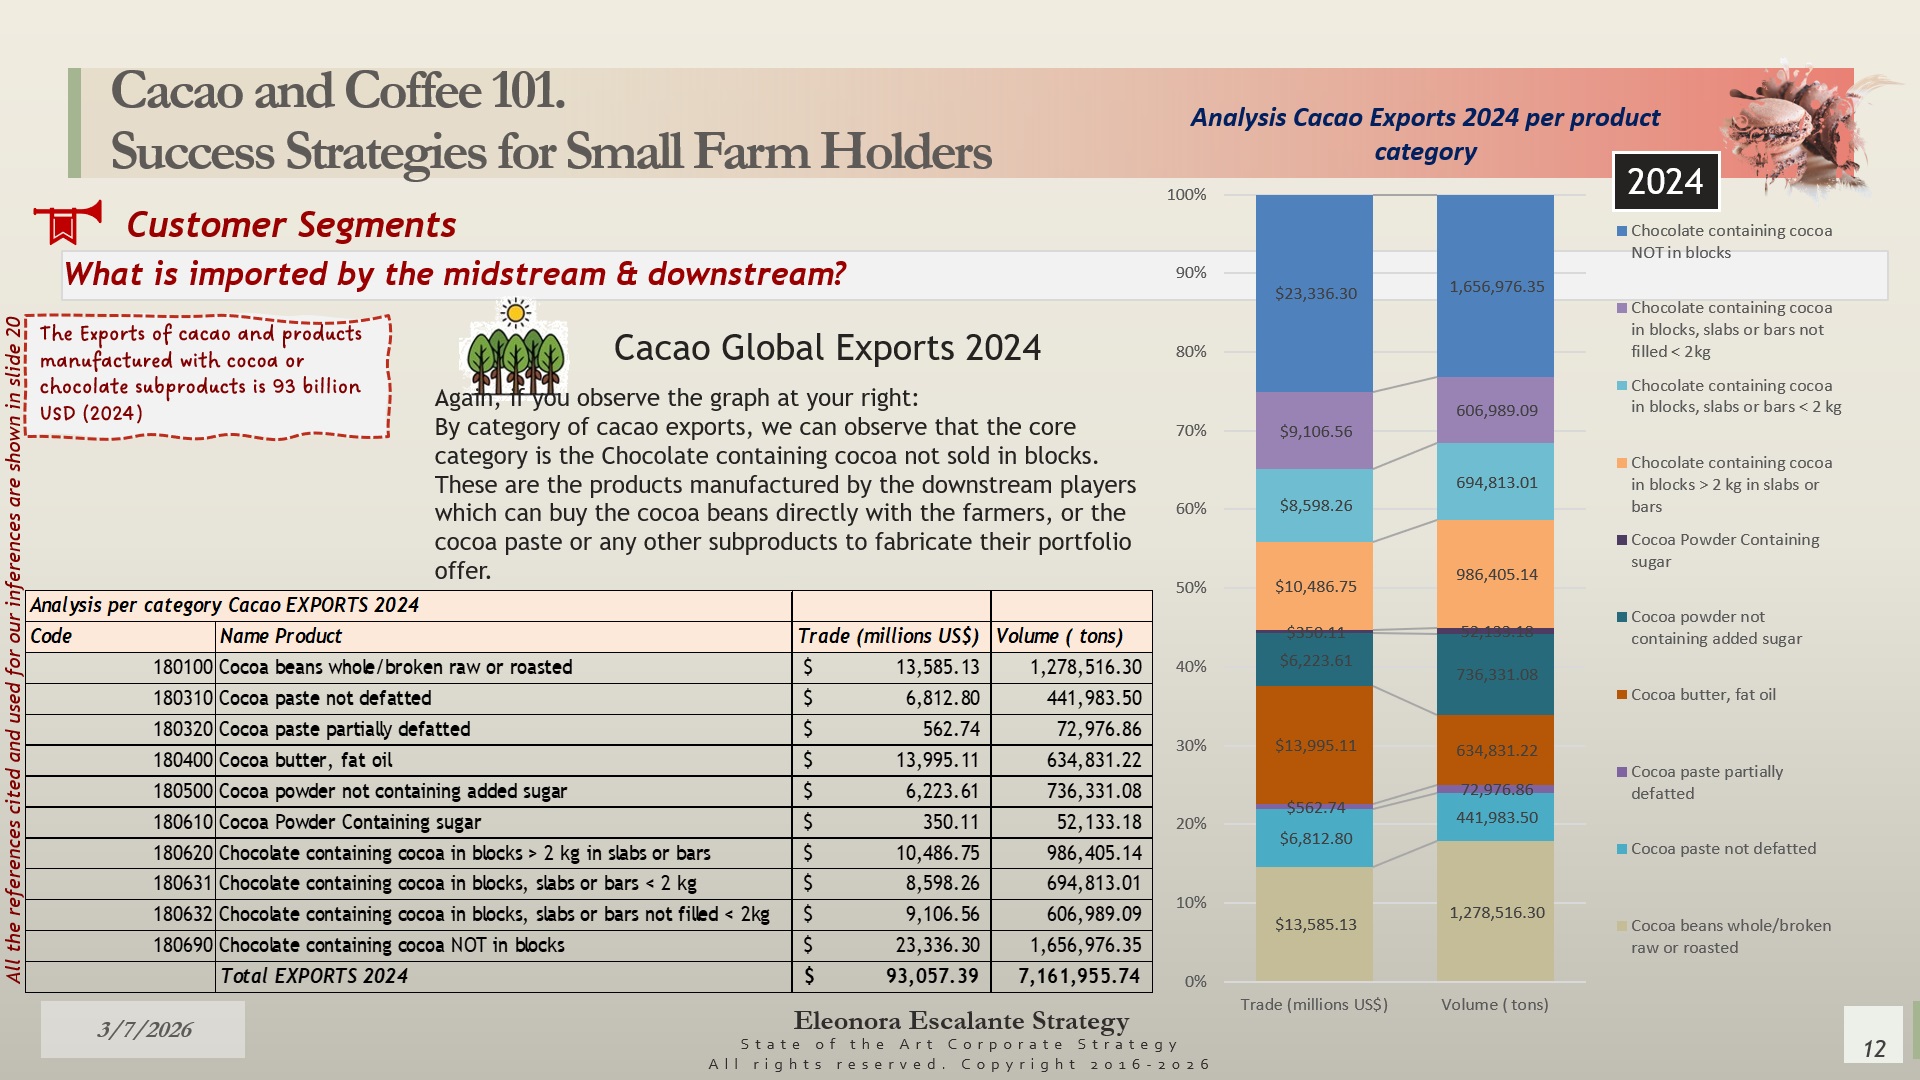
Our last slide of information is about the global exports of cacao in 2024. Analyzing the proportion of exports per category, the most relevant is the chocolate containing cocoa not in blocks, which implies that cacao has been processed and is located in the downstream players or final retailers. Exports of the cocoa beans barely arrive at $13.6 billion (add around $1.2 to 2 billion from Ghana), in comparison to chocolate containing cocoa not in blocks, with US$ 23.3 billion. The supply of cocoa butter and chocolate containing cocoa in blocks, slabs, or bars is also important (in terms of economic value and weight), as these are semi-processed raw materials used by the midstream and downstream organizations. In relation to the source of supply of cacao beans, the most important nation is Côte d’Ivoire, followed by Ecuador, Ghana, Nigeria, Cameroon, the Netherlands, Malaysia, Perú, the Dominican Republic, and the Republic of Congo. These 10 nations are exporting 95% of the cacao beans, mainly to Europe (year 2023).
The data from the United Nations Comtrade and World Bank WITS for cacao exports in 2024 is not complete. The data from the year 2024 has not pulled the information from Ghana, the Democratic Republic of the Congo, and Papua New Guinea, countries that belong to the top 25 nations in terms of exports. Moreover, there are only 81 countries listed in the database of 2024, in comparison to 100 nations from the year 2023. We will modify our numbers slightly, particularly for the case of Ghana, given the relative importance of this exporter state during this working week.
Selection of 3 customer segments. Preparation for next class.
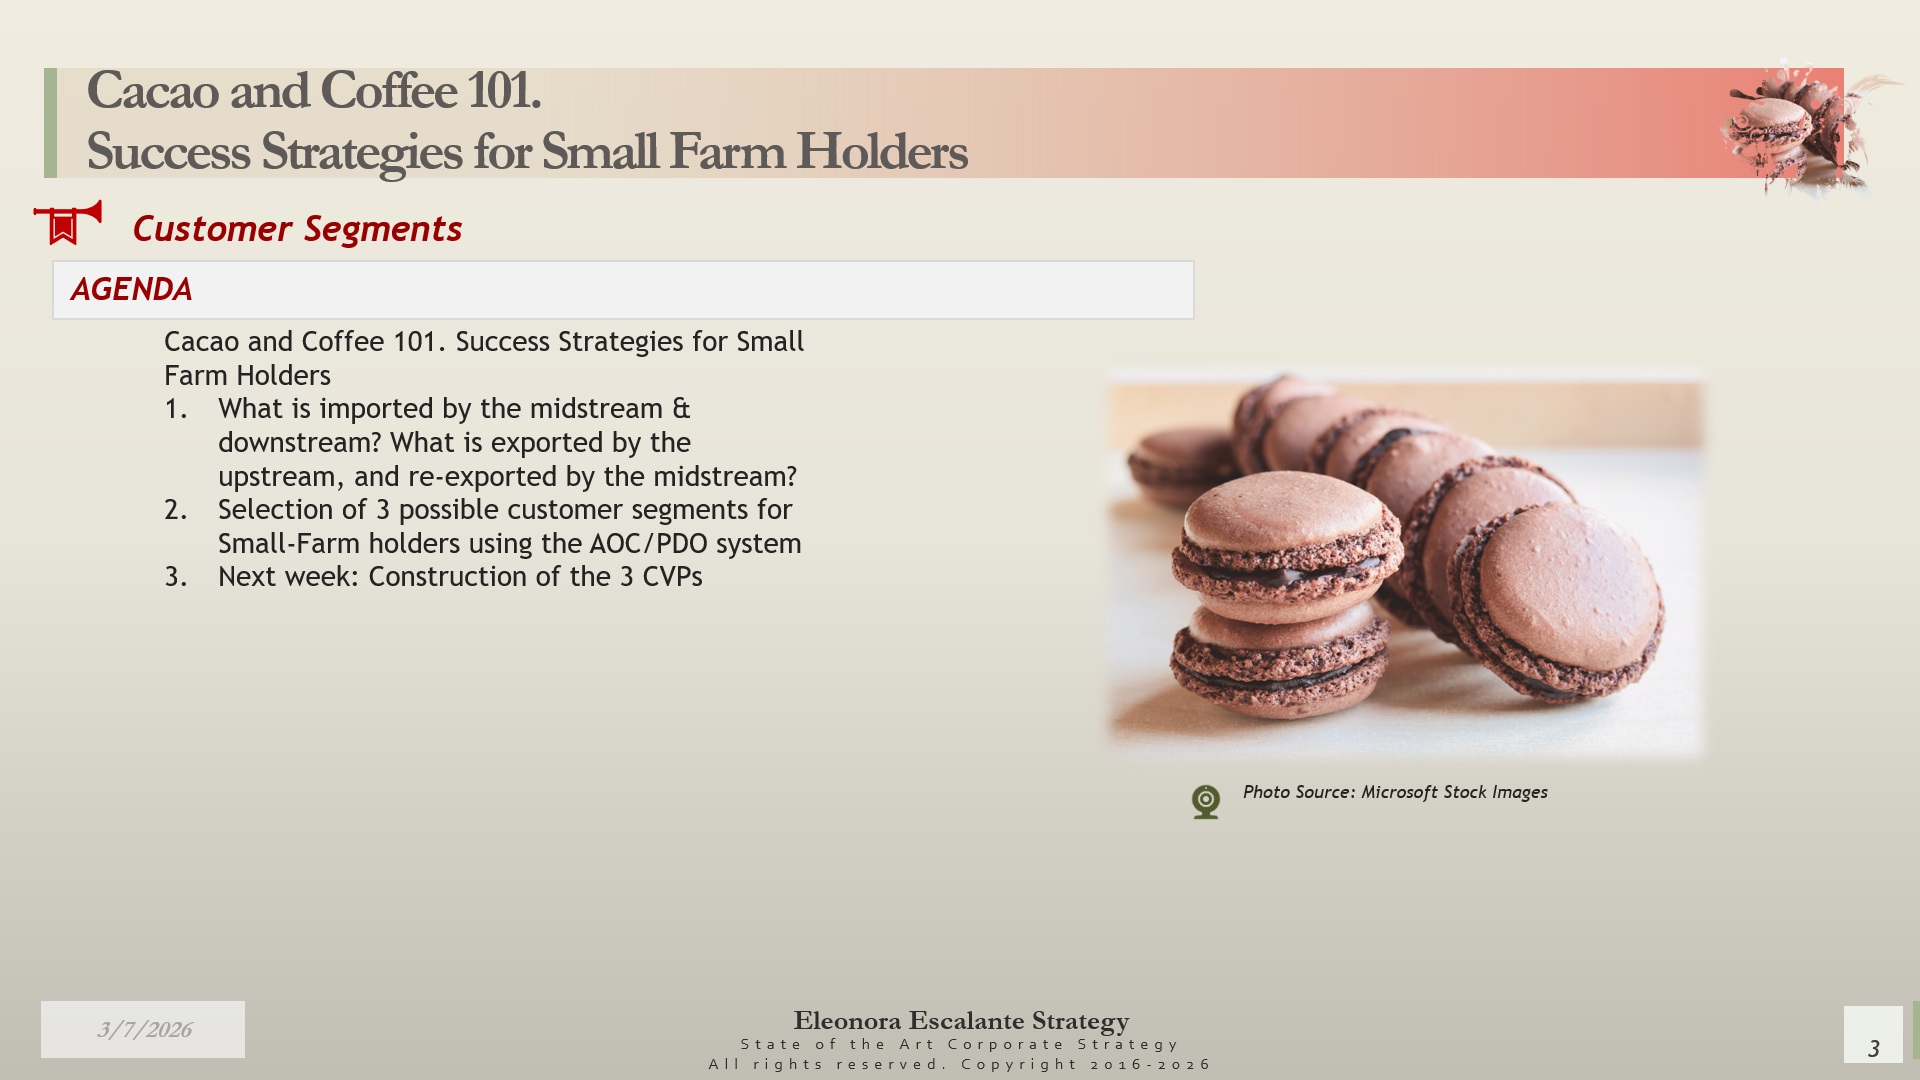
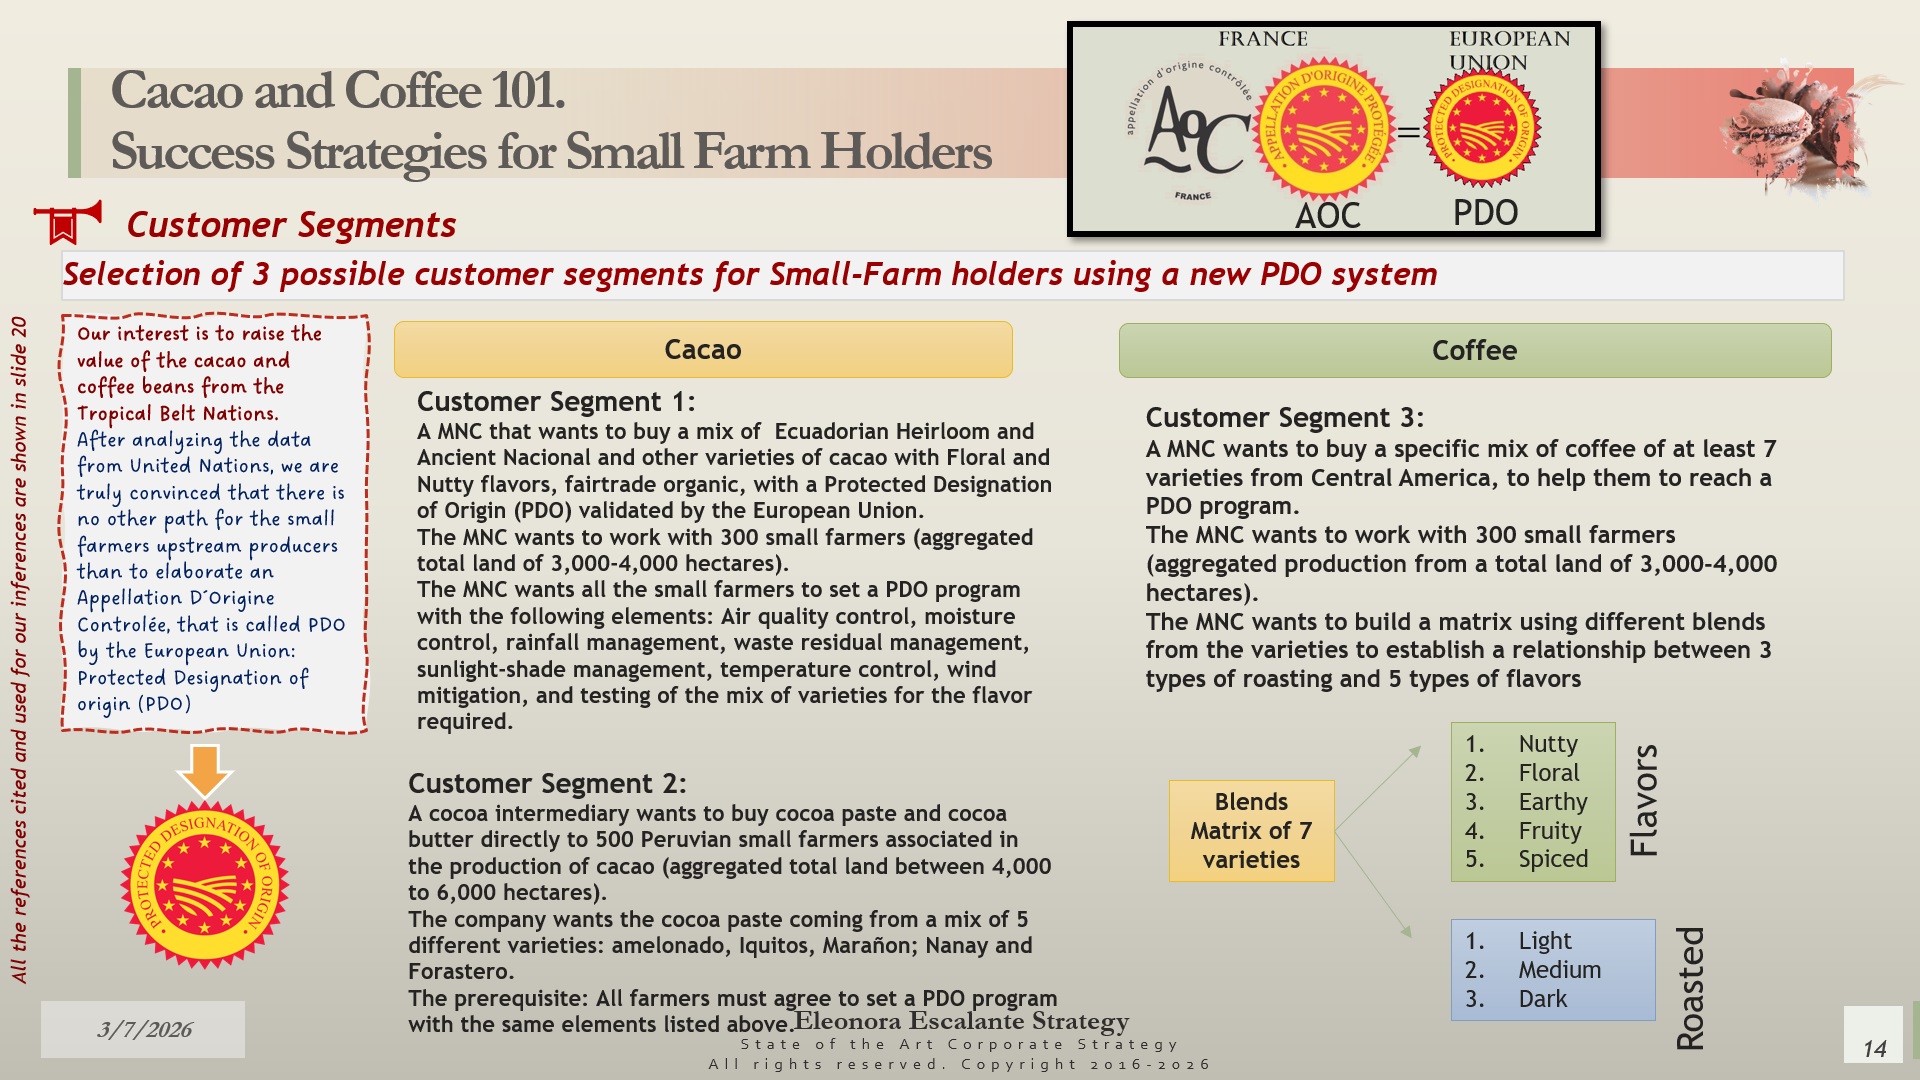
Despite the limitations or database incompleteness for cacao and coffee exports (2024), this exercise has helped us to reframe new customer segments. We are aligned with the stars to continue exploring three potential customer segments if the tropical belt nations decide to proceed with a Protected Designation of Origin system (PDO). See slide 14. We will build three customer value propositions for:
- A particular Ecuadorian Cacao bean mix for a European multinational corporation (MNC). This vertically integrated chocolate producer from the midstream section of the global value chain wants a particular supply requisite: The blend of cacao beans must include the Heirloom and Ancient Nacional varieties plus other local varieties produced in Ecuador, with a floral and nutty flavor when mild to medium roasting is applied. The farms should have a Fairtrade organic certification, with a PDO validated by the European Union. Additionally, the importer wants to help 300 small farmers set up the PDO program with environmental green climate finance indicators.
- A cacao intermediary wants to buy cocoa butter and cacao paste defatted to 500 Peruvian small farmers associated. The requisite of the supply is: the cacao paste should come from a mix of amelonado, Iquitos, marañon, Nanay, and Forastero varieties. The farmers must agree to set up a PDO program with environmentally friendly climate finance indicators.
- A multinational corporation in the Middle East wants to buy a specific mix of coffee beans of at least 7 native varieties from Central America to help 300 small farmers gain a PDO. The MNC wants to build a matrix using different blends, 3 different types of roasting, and 5 types of flavors.
Visit slide 9 for further information.
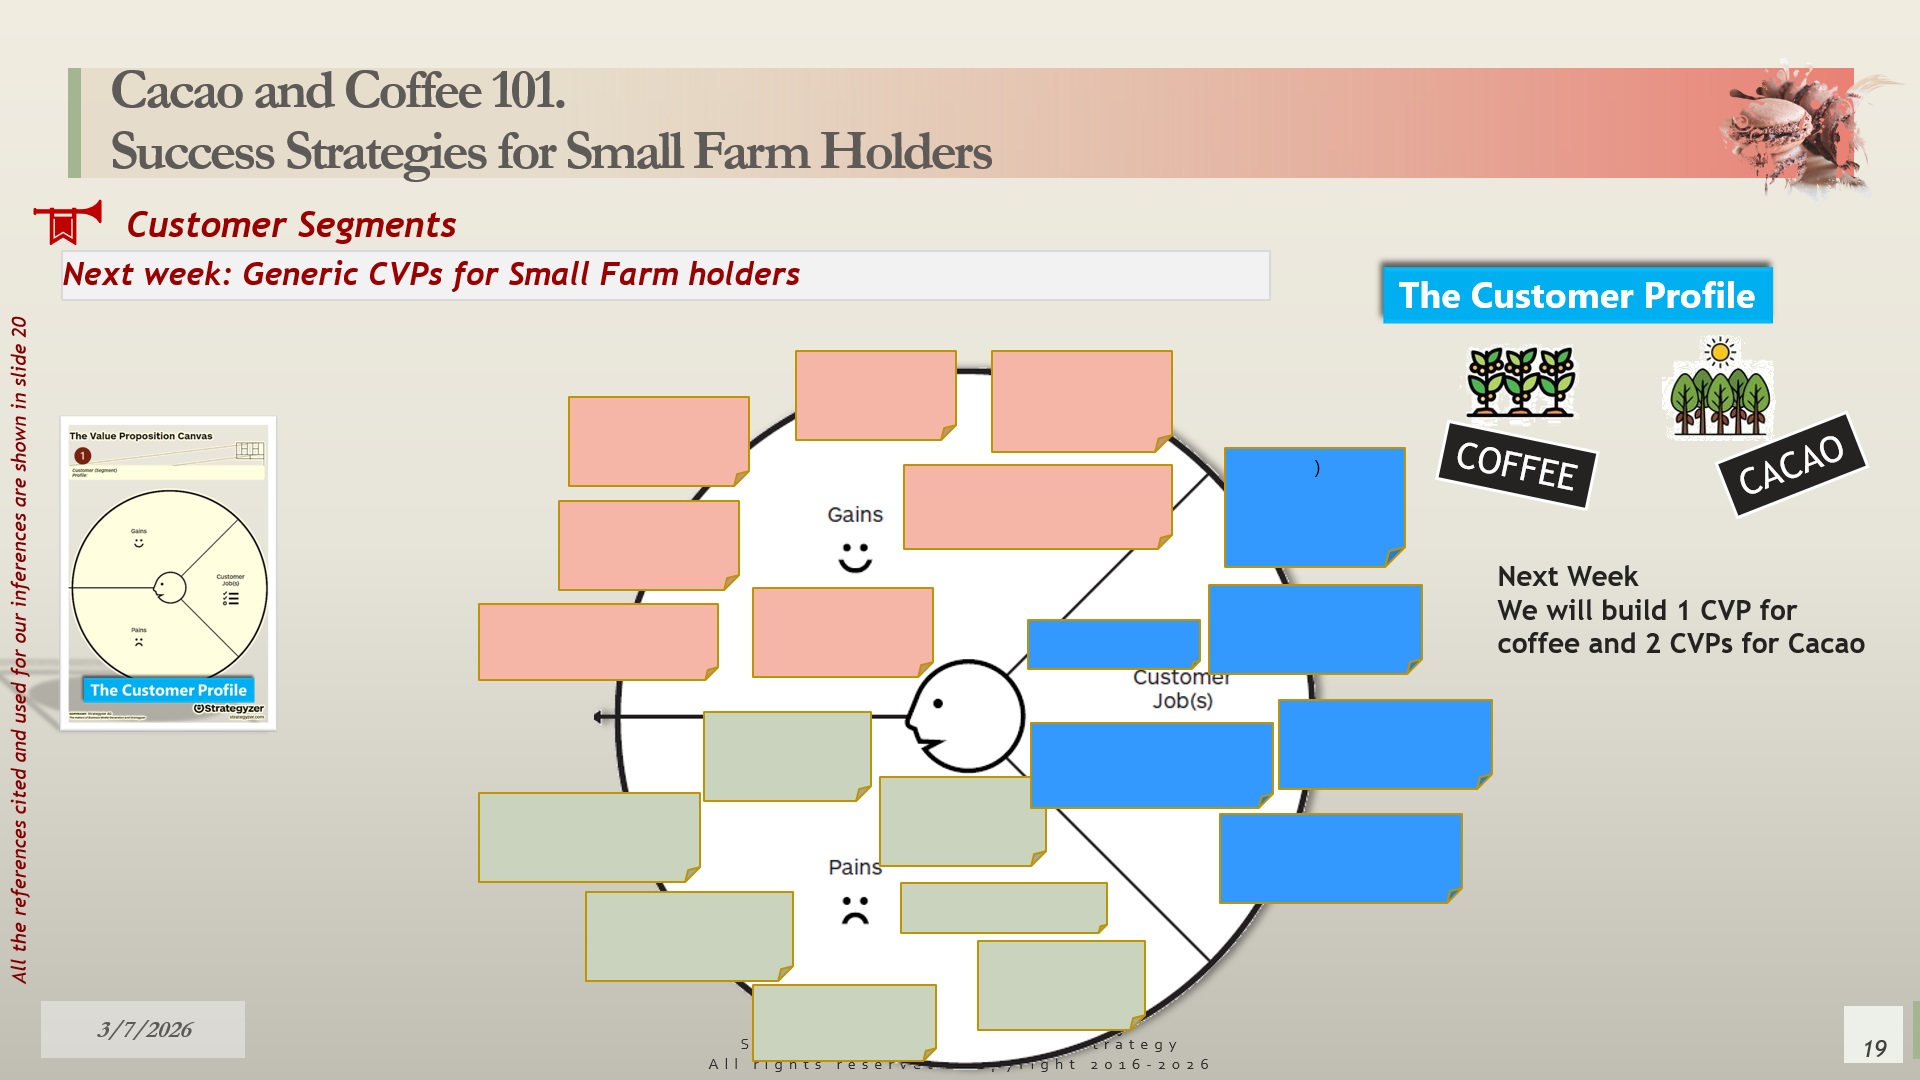
Announcement. Our next episode is about constructing three customer profiles: two for cacao and one for coffee. You will see how different it is to sell these precious beans once the Appellation d’Origine Contrôlée or Protected Designation of Origin is in place.
Musical Section.
This saga is committed to elevating traditional musical instruments and their respective musicians over digitally produced sounds. This saga is dedicated to the chamber orchestras.
Today, we have chosen the Prague Chamber Orchestra (PKO). Their unique interpretation of the Four Seasons of Vivaldi is joyful and festive! To find out more about the PKO, click here: https://www.pko.cz/en/home/
Enjoy!
Thank you for reading http://www.eleonoraescalantestrategy.com. It is a privilege to learn. Blessings.

Sources of reference and bibliography utilized for today´s inferences. The bibliography is listed on the last slide of the reference reading material. Click the respective URL to trace them.
Bibliography in this post: This will be added accordingly with the strategic reflections on Monday.
Disclaimer: Eleonora Escalante paints Illustrations in Watercolor. Other types of illustrations or videos (which are not mine) are used for educational purposes ONLY. All are used as Illustrative and non-commercial images. Utilized only informatively for the public good. Unless otherwise stated, I do not own any lovely photos or images.
 Eleonora Escalante Strategy Strategic Reflections Think Tank